Are the brokers, newsletters, and sentiment always wrong?
October/10/2008 15:19 Filed in: Fundamentals
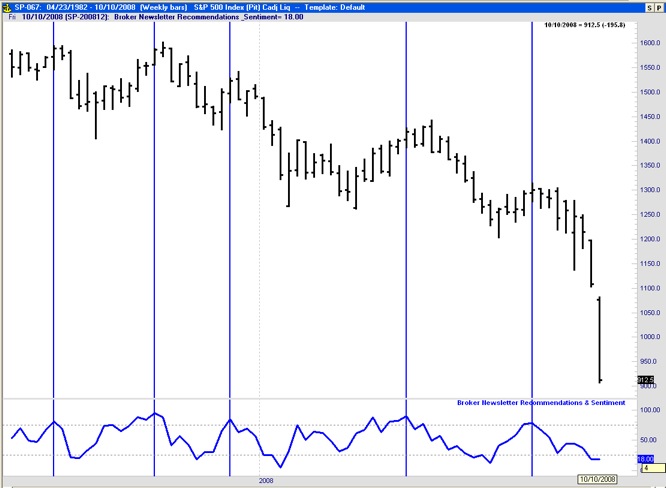
The chart below shows over a year of the S&P 500 on weekly bars on top (black) and an indicator that measures market sentiment directly from newsletters and broker recommendations at the bottom (blue). You can observe that this guys are consistently wrong. They are very bullish (as shown by indicator values above 80) after significant uptrends and this typically coincides with the end of the trend. Note how in the chart below every time the sentiment indicator went over 80% the market was at a top or very near a top proceeding a significant downtrend. They are consistently very bullish at market highs and very bearish at market lows. Note how once they get very bearish the market is typically close to a bottom also. It is important to emphasize that this behavior is not specific to the S&P500 or this year. I have studied hundreds of out of sample charts and this finding holds true. In the members area I elaborate a little bit more on why this crowd is so wrong and how we can use this information to our advantage.