Seasonal Analysis
Seasonal Analysis of Crude Oil
May/16/2009 14:15
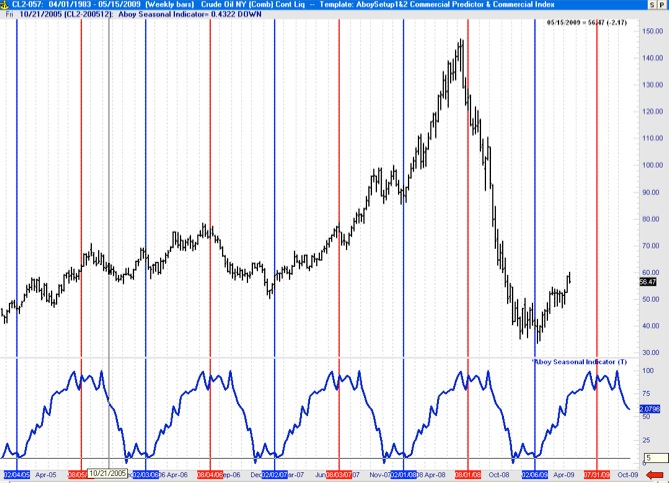
Below a show the results of my study on seasonal tendencies of crude oil (Crude Oil NY). The chart shows the price of crude oil from March 2005 to May 2009 (top plot) and the associated Aboy Seasonal Indicator developed from the daily crude oil time series from 1990 to 2007 (bottom plot in blue). As shown below there are strong seasonal tendencies is this energy commodity. Crude oil yearly lows typically occur around the first week of February and market highs around the last week of July and first week of August.
Seasonal Analysis of the S&P500 (2008/2009)
May/16/2009 10:54
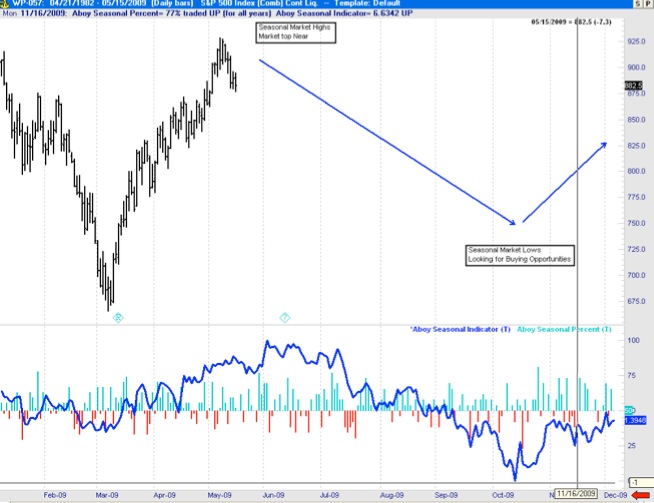
The chart below shows the price time series for the S&P500 (top plot) and my seasonality analysis based on my proprietary Aboy Seasonal Indicator (bottom plot in blue). This indicator is generated using S&P500 data from 1985 to 2007. We use it on this data to generate a predictive seasonal indicator for the following year (e.g. 2008/9). Based on this seasonal indicator, for instance, we knew that the market would make lows in the October 08 and November 08 timeframe, as well as the March 2009. The March 2009 was indeed a very good entry point. These seasonal tendencies indicate that the market is about to top (June/July timeframe). This indicates that it may be a good time to exit around now and wait for good buying opportunities (i.e. market lows) in the October/November timeframe.
Aboy Seasonal Percent indicates the proportion of times a given trading day of the year close up (green) or down (red) over the 1985 to 2007 period.
FEBRUARY 2009 TO MAY 2009:
Prediction based on Seasonal Tendencies from May 09 to December 09
MAY 2008 TO MAY 2009:
Prediction based on Seasonal Tendencies from May 09 to December 09
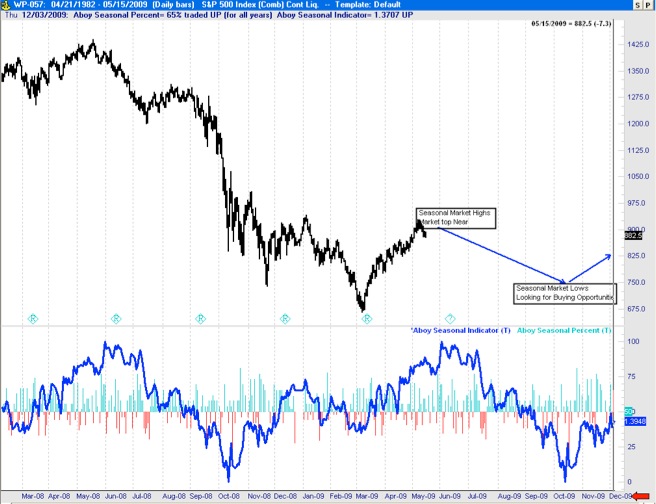