Energy Markets
Setup Conditions for RBOB Gasoline
May/31/2009 23:31
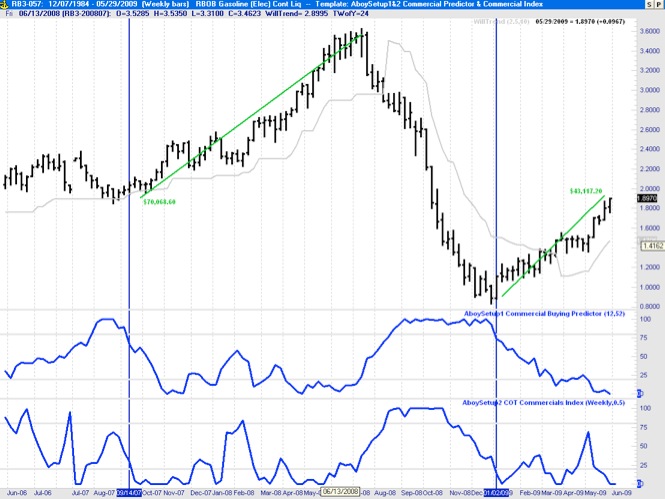
The chart below shows the price time series for RBOB Gasoline and two indicators, namely, the AboySetup1 Commercial Buying Predictor (i.e. a proxy for the COT proxy indicator) and the actual COT commercial index based on the commercial data. As we had already mentioned in previous posts, good setup conditions for long entry correspond to values greater than 80% in these indicators.
While these indicators are not intended to be used as entry techniques (e.g. once the setup condition is met other entry techniques can be used to obtain better results), a rough estimate for the long entry point occurs when AboySetup1 crosses the 80% line downward. The last two times this condition was met it resulted in gains of over $70,000 and $43,000 per contract, respectively.
Note also that the commercials are out of the market right now. We need to watch out for a possible correction/reversal downwards.
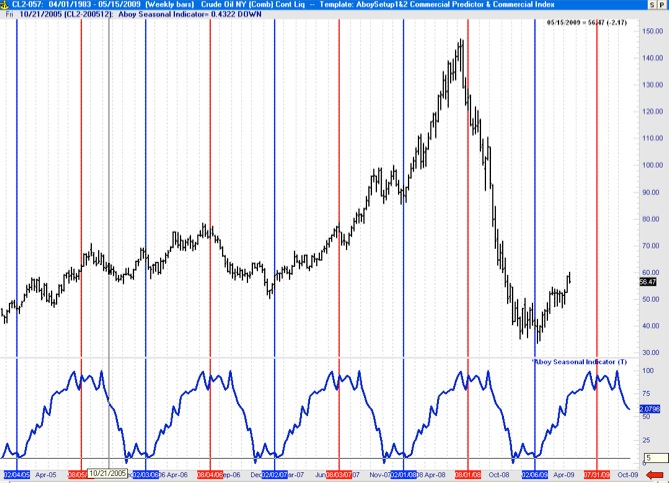
Seasonal Analysis of Crude Oil
May/16/2009 14:15
Below a show the results of my study on seasonal tendencies of crude oil (Crude Oil NY). The chart shows the price of crude oil from March 2005 to May 2009 (top plot) and the associated Aboy Seasonal Indicator developed from the daily crude oil time series from 1990 to 2007 (bottom plot in blue). As shown below there are strong seasonal tendencies is this energy commodity. Crude oil yearly lows typically occur around the first week of February and market highs around the last week of July and first week of August.