Proprietary Indicators
Setup Conditions for RBOB Gasoline
May/31/2009 23:31
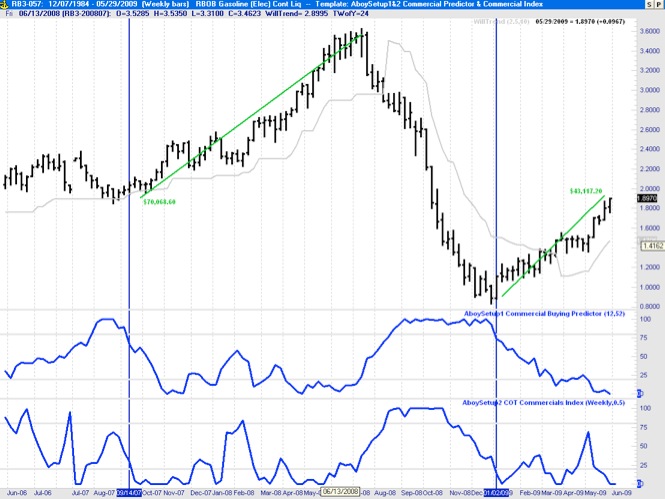
The chart below shows the price time series for RBOB Gasoline and two indicators, namely, the AboySetup1 Commercial Buying Predictor (i.e. a proxy for the COT proxy indicator) and the actual COT commercial index based on the commercial data. As we had already mentioned in previous posts, good setup conditions for long entry correspond to values greater than 80% in these indicators.
While these indicators are not intended to be used as entry techniques (e.g. once the setup condition is met other entry techniques can be used to obtain better results), a rough estimate for the long entry point occurs when AboySetup1 crosses the 80% line downward. The last two times this condition was met it resulted in gains of over $70,000 and $43,000 per contract, respectively.
Note also that the commercials are out of the market right now. We need to watch out for a possible correction/reversal downwards.
Actual Trade Results based on AboySetup1 (COT Proxy)
May/31/2009 22:51
I have been using the AboySetup1 Commercial Buying Predictor (COT Proxy) to guide actual stock trades. Below are the results of a sample real trade (entry during the first week of March and exit the first week of May).
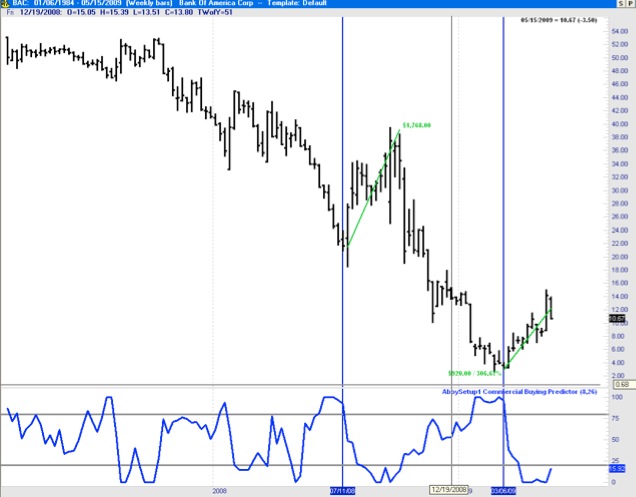
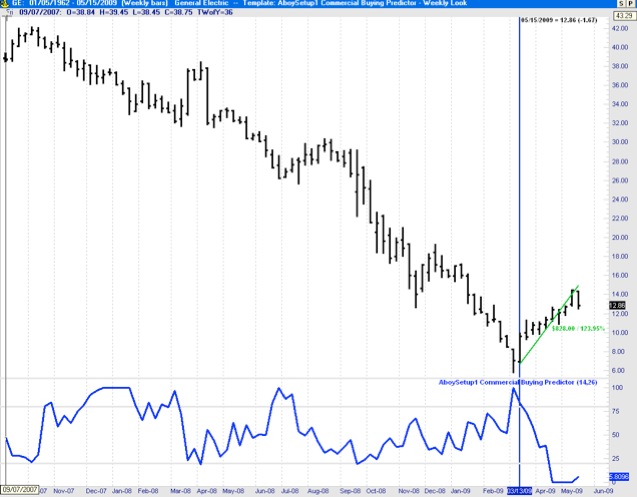
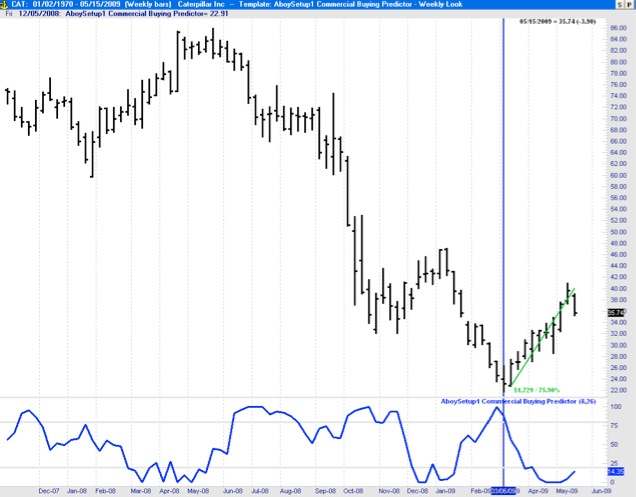
SCREENSHOTS WITH ACTUAL RESULTS: BAC (268.10%), GE (106.62%), CAT (58.07%)
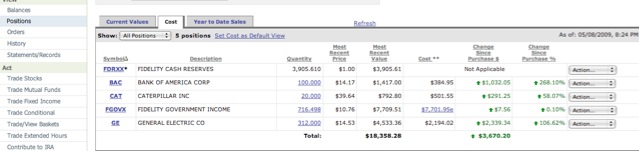
BANK OF AMERICA (BAC): March to May. Actual Realized Gain: 268%
GENERAL ELECTRIC (GE) : March to May. Actual Realized Gain: 106.62%
CATERPILLAR (CAT) : March to May. Actual Realized Gain: 58.07%
SCREENSHOTS WITH ACTUAL RESULTS: BAC (268.10%), GE (106.62%), CAT (58.07%)
BANK OF AMERICA (BAC): March to May. Actual Realized Gain: 268%
GENERAL ELECTRIC (GE) : March to May. Actual Realized Gain: 106.62%
CATERPILLAR (CAT) : March to May. Actual Realized Gain: 58.07%
Follow-up on Anounced Choices
May/30/2009 00:11
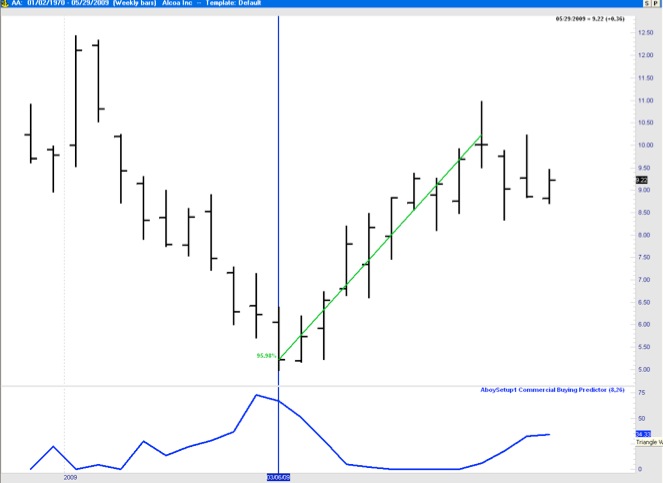
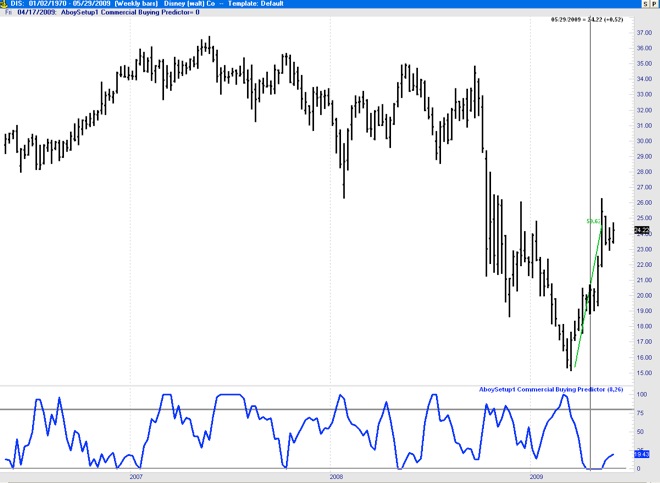
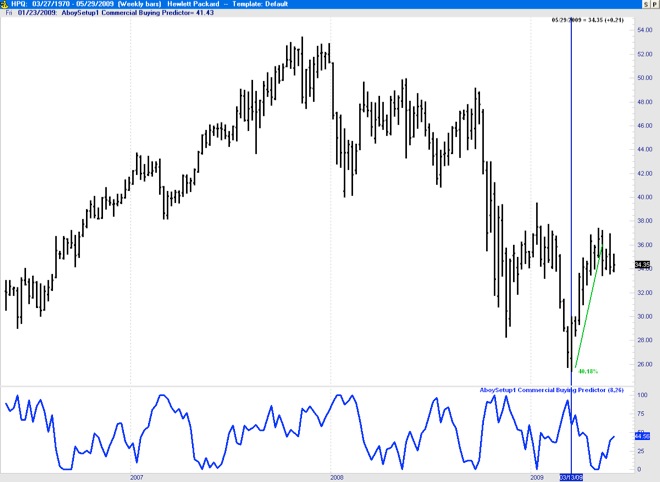
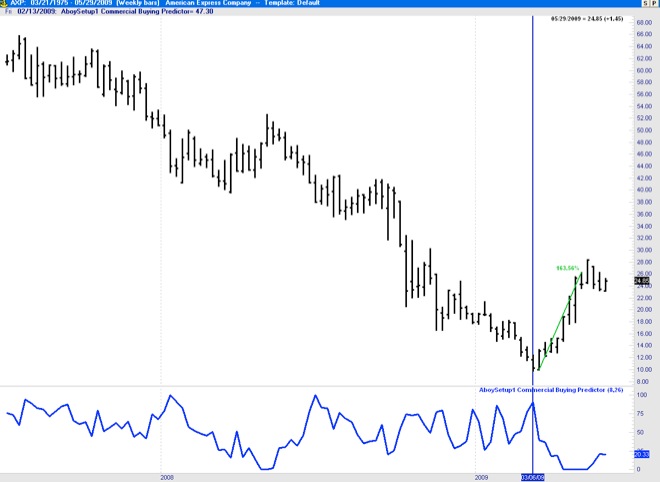
Back in October I selected GE, DIS, HPQ, AXP, and AA as the stocks with potential for beating the Dow Jones this year. As always we must wait to enter until the setup conditions are met at least based on the AboySetup1 Commercial Buying Predictor - COT Proxy (see other posts for specifics about this proprietary indicator) and confirmed by others such as the ADX. Based on the S&P500 seasonality, good entries typically happen in October or March. This year, however, the setup conditions for Long Entry were not meet until the first week of March (for most of them, see charts below) and Exit setup conditions took placed in the first week of May (which is also a good exit month based on seasonality). Here is a report with the results based on two months in the market: AA (95%), DIS (52%), HP (42%), AXP (163%), GE (106%).
ALCOA (AA): 95.98%
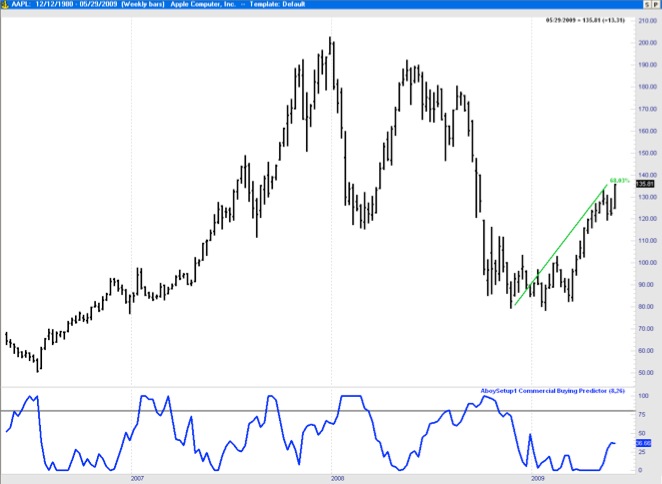
APPLE (AAPL): 68.03%
DISNEY(DIS): 52%
HEWLETT PACKARD (HPQ): 40.18%
AMERICAN EXPRESS COMPANY (AXP): 163%
ALCOA (AA): 95.98%
APPLE (AAPL): 68.03%
DISNEY(DIS): 52%
HEWLETT PACKARD (HPQ): 40.18%
AMERICAN EXPRESS COMPANY (AXP): 163%
Seasonal Analysis of Crude Oil
May/16/2009 14:15
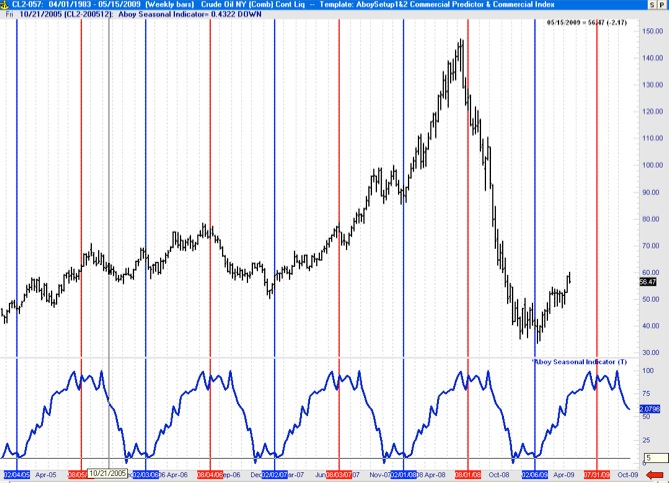
Below a show the results of my study on seasonal tendencies of crude oil (Crude Oil NY). The chart shows the price of crude oil from March 2005 to May 2009 (top plot) and the associated Aboy Seasonal Indicator developed from the daily crude oil time series from 1990 to 2007 (bottom plot in blue). As shown below there are strong seasonal tendencies is this energy commodity. Crude oil yearly lows typically occur around the first week of February and market highs around the last week of July and first week of August.
Seasonal Analysis of the S&P500 (2008/2009)
May/16/2009 10:54
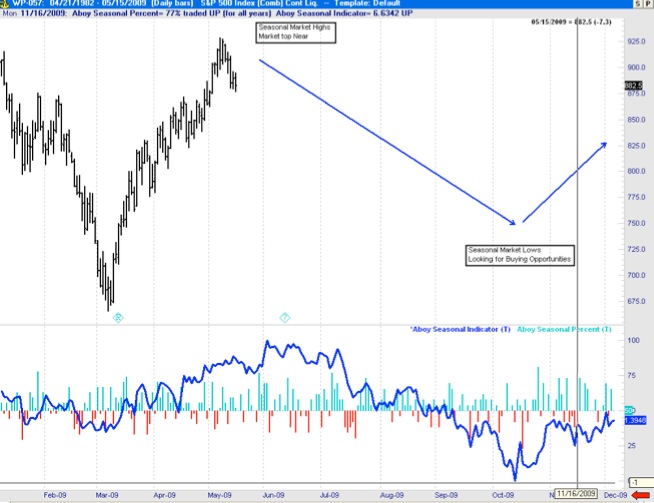
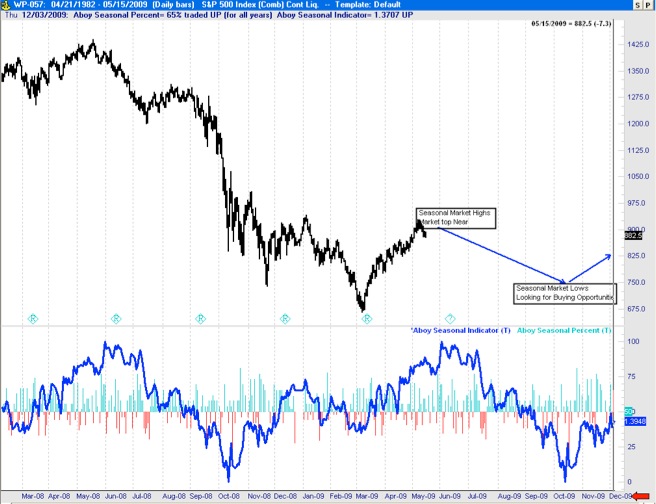
The chart below shows the price time series for the S&P500 (top plot) and my seasonality analysis based on my proprietary Aboy Seasonal Indicator (bottom plot in blue). This indicator is generated using S&P500 data from 1985 to 2007. We use it on this data to generate a predictive seasonal indicator for the following year (e.g. 2008/9). Based on this seasonal indicator, for instance, we knew that the market would make lows in the October 08 and November 08 timeframe, as well as the March 2009. The March 2009 was indeed a very good entry point. These seasonal tendencies indicate that the market is about to top (June/July timeframe). This indicates that it may be a good time to exit around now and wait for good buying opportunities (i.e. market lows) in the October/November timeframe.
Aboy Seasonal Percent indicates the proportion of times a given trading day of the year close up (green) or down (red) over the 1985 to 2007 period.
FEBRUARY 2009 TO MAY 2009:
Prediction based on Seasonal Tendencies from May 09 to December 09
MAY 2008 TO MAY 2009:
Prediction based on Seasonal Tendencies from May 09 to December 09
Analysis of Stocks using AboySetup1
February/11/2009 19:32
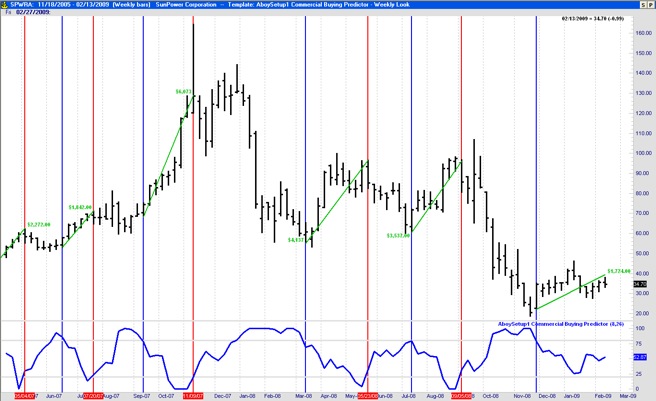
One of my readers emailed me asking about using my “Aboy1 Commercial Buying Predictor” (designed for commodities) to analyze setup conditions for individual stocks. As I mentioned in previous postings, this proprietary indicator can be calculated from the price time-series only (it does not require COT data). Consequently, it is available for individual stocks and it is extremely useful. The reader specifically asked for an analysis of a specific stock (SPWRA: SunPower Corporation) using the AboySetup1 indicator.
Below I show the chart of the requested stock (SPWRA) with the AboySetup1 indicator at the bottom. When this indicator goes over 80% it indicates a good setup condition for buying and when it goes under 20% it indicates a good setup condition for selling. While AboySetup1 is not designed as an indicator to determine entry, it can be used get a general sense on when to enter (AboySetup1 crosses downward the 80% line -shown as a blue line on the chart) and exit (Aboy1 crosses upward the 20% line -shown as a red line) the market.
Below I show the chart of the requested stock (SPWRA) with the AboySetup1 indicator at the bottom. When this indicator goes over 80% it indicates a good setup condition for buying and when it goes under 20% it indicates a good setup condition for selling. While AboySetup1 is not designed as an indicator to determine entry, it can be used get a general sense on when to enter (AboySetup1 crosses downward the 80% line -shown as a blue line on the chart) and exit (Aboy1 crosses upward the 20% line -shown as a red line) the market.
Analysis of Gold using AboySetup1
February/01/2009 23:26
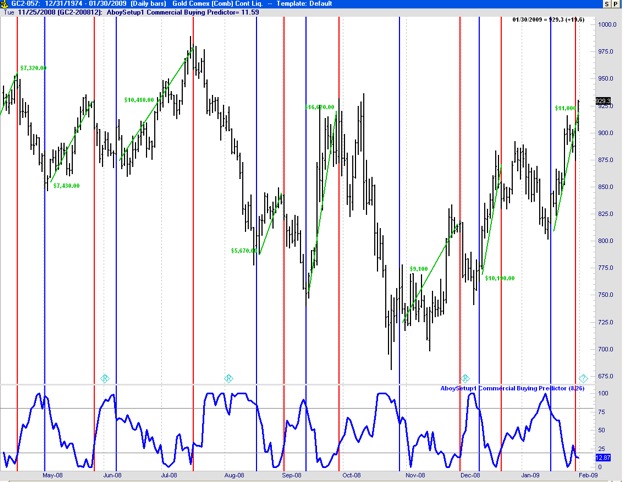
A couple of people have emailed me asking about my proprietary setup indicator (AboySetup1) and how well does it do in Gold. Below is a chart showing Gold and the AboySetup1 indicator. In blue I marked the entry points based only on setup conditions (i.e. AboySetup1 > 80% and entering when AboySetup1 crosses downward the 80% line). The exit is marked when AboySetup1 goes low <20% and crosses upward the 20% line (seen in red). I only marked the profits made from May 08 to February 09 taking the LONG positions. The profits taking the SHORT positions are even better (i.e. entering short at the start of the red line and exiting the position once we reach the blue line). The margin required is to trade the Gold contract $2,025.00. The profits over this period using only this indicator (taking both long and short positions) are over $100,000 (on an initial $10,000 account -i.e. $2,025 to trade the contract, and the rest for margin).
An Important Novel Indicator (AboySetup1)
October/03/2008 21:26
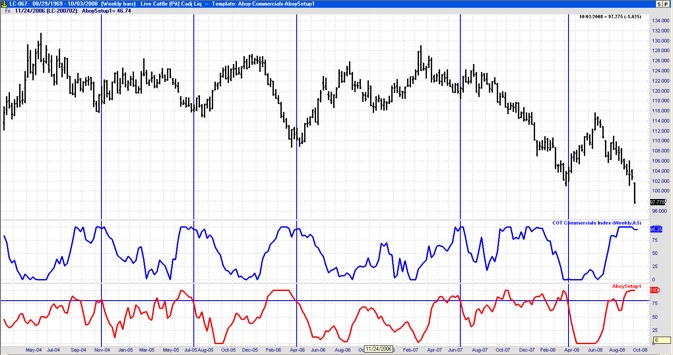
The chart below shows a new indicator that is very useful to determine setup conditions for futures, commodities, and also individual stocks. The indicator on the top (blue line) shows the COT Commercial Indicator based on the positions of the commercials obtained from the Commitment of Traders report (the indicator is developed as a stochastic function of the commercial positions). The positions of the commercials are very useful to determine setup conditions and we will use them extensively in the development of our mechanical trading systems. The commercials have a very good track record of buying lows in the market and selling highs.
The main limitation of the COT indicator is that it requires an additional data service (COT data) and that this information is only available for selected commodities in the US. The indicator shown in red (AboySetup1) shows a setup indicator developed exclusively using the price time-series (i.e. it does not require the COT positions as an input). It is important to note that it is very correlated with the action of the commercials and serves to determine setup conditions for both futures and stocks. High values of the AboySetup1 indicate that a market uptrend turn may be near (setup condition) and low values indicate the opposite. A rough entry point that typically works well is to wait until the AboySetup1 crosses below 80% as shown in the chart. The specific entry should be determined using specialized entry techniques once this setup market condition is met. The AboySetup1 is designed to help us determine short and intermediate term setup conditions. Thus, it helps us enter at a local minima in the price time-series but we still have to use an appropriate exit technique to get out of the trade and take our profit successfully.
To my knowledge only Larry Williams has developed a similar indicator which he refers to as a COT proxy indicator. The AboySetup1 indicator was developed independently and uses a different underlying formula. At the moment we have developed 12 different versions of this COT proxy indicator relying on different formulas. This indicates that there are many possibilities to obtain similar indicators but this specific one is the one I found to perform the best.
I personally establish setup conditions based on 6 indicators. The first one (AboySetup1) is described here. The other 5 will be described on future entries.