Stocks
Actual Trade Results based on AboySetup1 (COT Proxy)
May/31/2009 22:51
I have been using the AboySetup1 Commercial Buying Predictor (COT Proxy) to guide actual stock trades. Below are the results of a sample real trade (entry during the first week of March and exit the first week of May).
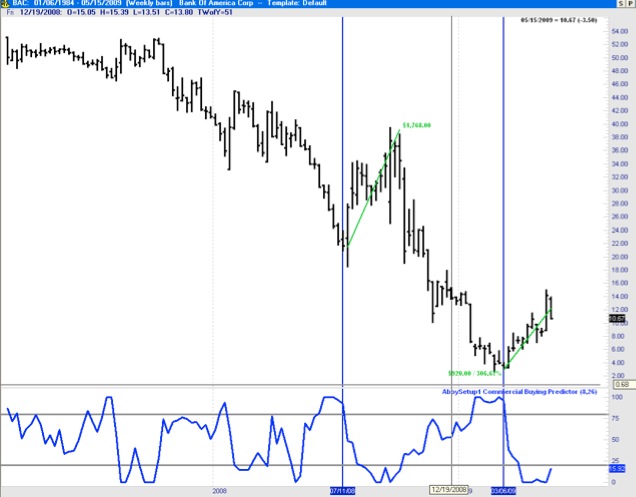
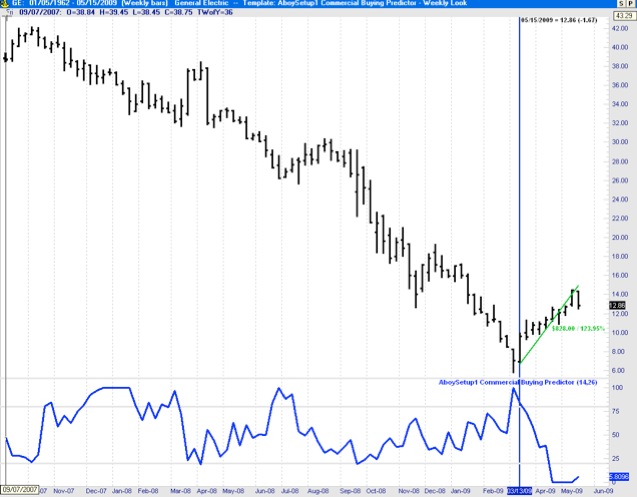
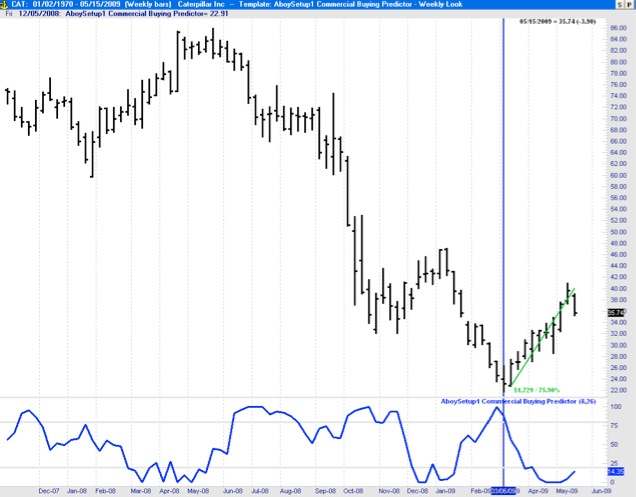
SCREENSHOTS WITH ACTUAL RESULTS: BAC (268.10%), GE (106.62%), CAT (58.07%)
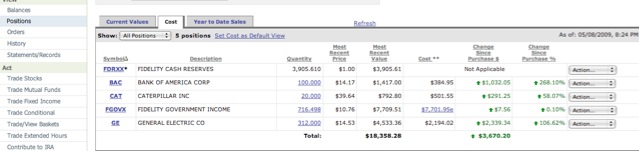
BANK OF AMERICA (BAC): March to May. Actual Realized Gain: 268%
GENERAL ELECTRIC (GE) : March to May. Actual Realized Gain: 106.62%
CATERPILLAR (CAT) : March to May. Actual Realized Gain: 58.07%
SCREENSHOTS WITH ACTUAL RESULTS: BAC (268.10%), GE (106.62%), CAT (58.07%)
BANK OF AMERICA (BAC): March to May. Actual Realized Gain: 268%
GENERAL ELECTRIC (GE) : March to May. Actual Realized Gain: 106.62%
CATERPILLAR (CAT) : March to May. Actual Realized Gain: 58.07%
Follow-up on Anounced Choices
May/30/2009 00:11
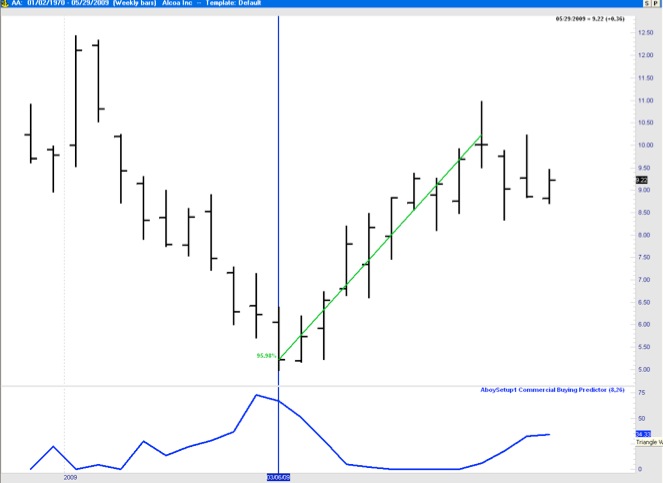
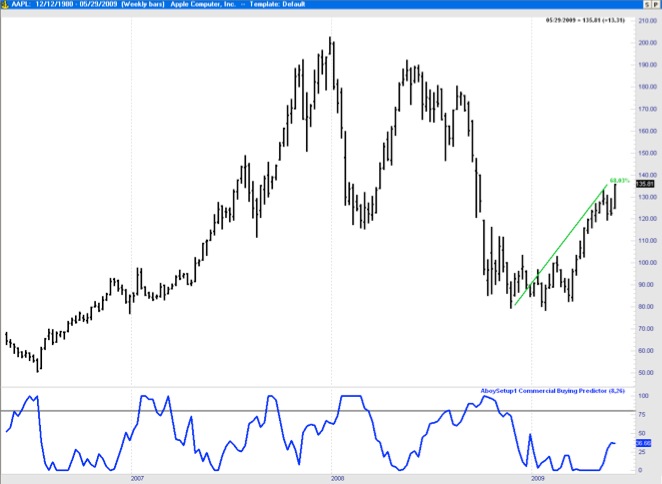
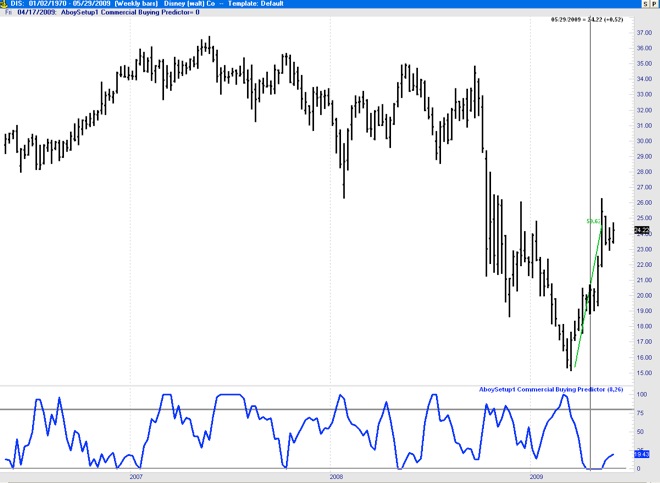
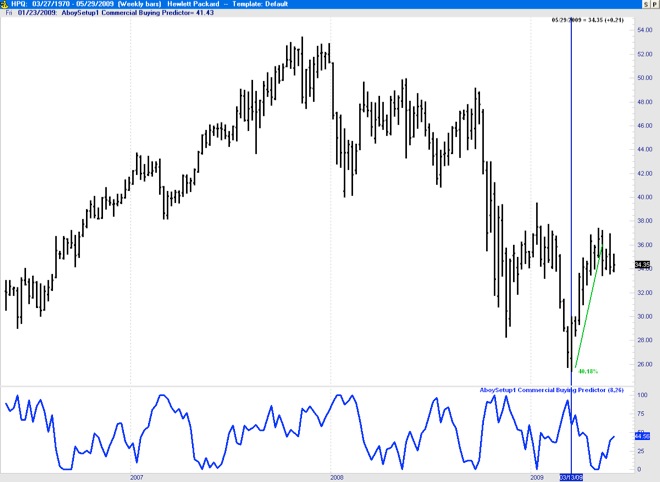
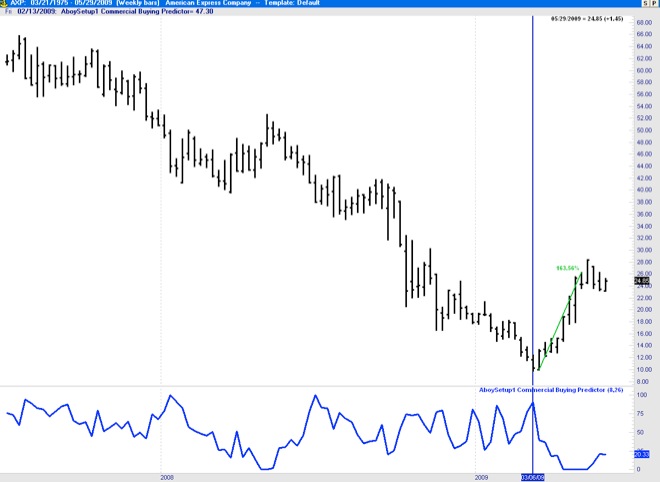
Back in October I selected GE, DIS, HPQ, AXP, and AA as the stocks with potential for beating the Dow Jones this year. As always we must wait to enter until the setup conditions are met at least based on the AboySetup1 Commercial Buying Predictor - COT Proxy (see other posts for specifics about this proprietary indicator) and confirmed by others such as the ADX. Based on the S&P500 seasonality, good entries typically happen in October or March. This year, however, the setup conditions for Long Entry were not meet until the first week of March (for most of them, see charts below) and Exit setup conditions took placed in the first week of May (which is also a good exit month based on seasonality). Here is a report with the results based on two months in the market: AA (95%), DIS (52%), HP (42%), AXP (163%), GE (106%).
ALCOA (AA): 95.98%
APPLE (AAPL): 68.03%
DISNEY(DIS): 52%
HEWLETT PACKARD (HPQ): 40.18%
AMERICAN EXPRESS COMPANY (AXP): 163%
ALCOA (AA): 95.98%
APPLE (AAPL): 68.03%
DISNEY(DIS): 52%
HEWLETT PACKARD (HPQ): 40.18%
AMERICAN EXPRESS COMPANY (AXP): 163%
Seasonal Analysis of the S&P500 (2008/2009)
May/16/2009 10:54
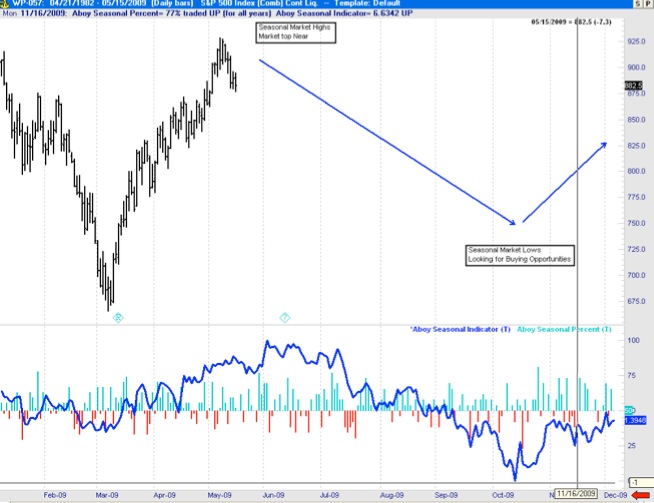
The chart below shows the price time series for the S&P500 (top plot) and my seasonality analysis based on my proprietary Aboy Seasonal Indicator (bottom plot in blue). This indicator is generated using S&P500 data from 1985 to 2007. We use it on this data to generate a predictive seasonal indicator for the following year (e.g. 2008/9). Based on this seasonal indicator, for instance, we knew that the market would make lows in the October 08 and November 08 timeframe, as well as the March 2009. The March 2009 was indeed a very good entry point. These seasonal tendencies indicate that the market is about to top (June/July timeframe). This indicates that it may be a good time to exit around now and wait for good buying opportunities (i.e. market lows) in the October/November timeframe.
Aboy Seasonal Percent indicates the proportion of times a given trading day of the year close up (green) or down (red) over the 1985 to 2007 period.
FEBRUARY 2009 TO MAY 2009:
Prediction based on Seasonal Tendencies from May 09 to December 09
MAY 2008 TO MAY 2009:
Prediction based on Seasonal Tendencies from May 09 to December 09
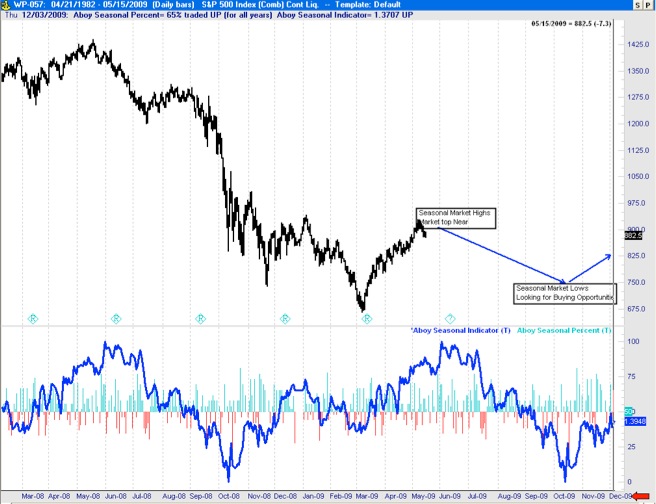
Analysis of Stocks using AboySetup1
February/11/2009 19:32
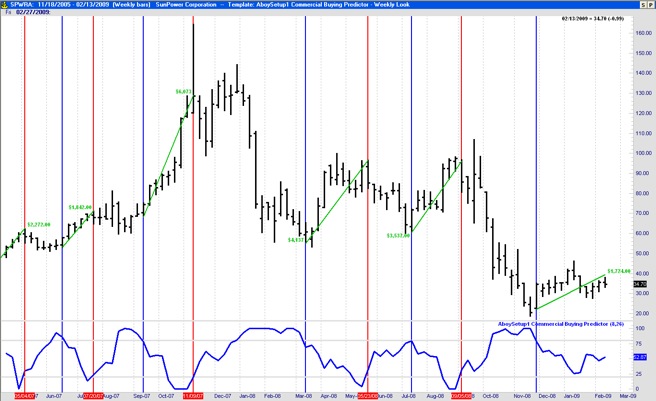
One of my readers emailed me asking about using my “Aboy1 Commercial Buying Predictor” (designed for commodities) to analyze setup conditions for individual stocks. As I mentioned in previous postings, this proprietary indicator can be calculated from the price time-series only (it does not require COT data). Consequently, it is available for individual stocks and it is extremely useful. The reader specifically asked for an analysis of a specific stock (SPWRA: SunPower Corporation) using the AboySetup1 indicator.
Below I show the chart of the requested stock (SPWRA) with the AboySetup1 indicator at the bottom. When this indicator goes over 80% it indicates a good setup condition for buying and when it goes under 20% it indicates a good setup condition for selling. While AboySetup1 is not designed as an indicator to determine entry, it can be used get a general sense on when to enter (AboySetup1 crosses downward the 80% line -shown as a blue line on the chart) and exit (Aboy1 crosses upward the 20% line -shown as a red line) the market.
Below I show the chart of the requested stock (SPWRA) with the AboySetup1 indicator at the bottom. When this indicator goes over 80% it indicates a good setup condition for buying and when it goes under 20% it indicates a good setup condition for selling. While AboySetup1 is not designed as an indicator to determine entry, it can be used get a general sense on when to enter (AboySetup1 crosses downward the 80% line -shown as a blue line on the chart) and exit (Aboy1 crosses upward the 20% line -shown as a red line) the market.