ETF instead of Futures Contracts
December/20/2009 10:55 Filed in: Fundamentals
Several people have emailed me regarding alternatives to future contracts. The issue is that some people do not feel comfortable with the high-leverage, rolling over futures contracts, etc. Please note that all these techniques (i.e. COT proxy, etc) can be used with ETFs. Below are some important ETFs to know:
- SPY : S&P 500 Index
- DIA : Dow Jones Industrial Average
- QQQQ : NASDAQ Index
- IWM : Russel 2000 Index
- IEV : S&P Europe 350 Index
- EWJ : MSCI Japan Index
- DBA : Agriculture Commodity Index (Corn, Soybeans, Wheat, Sugar)
- US0: Oil
- UGA: Gasoline
- GLD: Gold
- DBB : Aluminum, zinc, copper
- GSC: 24 commodities including energy, agriculture, and precious metals
- UUP : Dollar Bullish
- UDN : Dollar Bearish
Setup Conditions for RBOB Gasoline
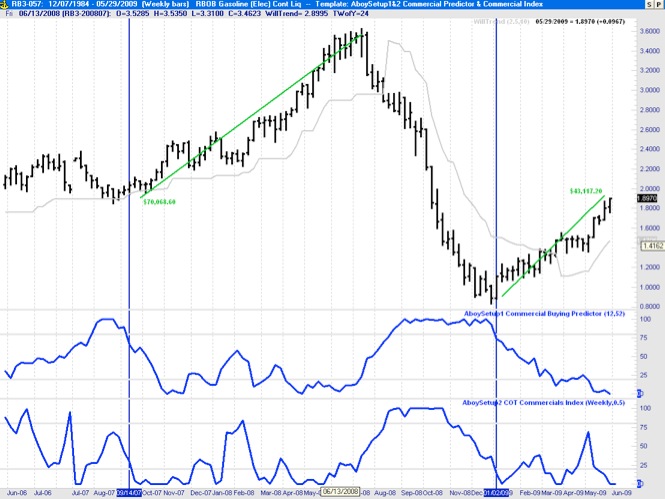
The chart below shows the price time series for RBOB Gasoline and two indicators, namely, the AboySetup1 Commercial Buying Predictor (i.e. a proxy for the COT proxy indicator) and the actual COT commercial index based on the commercial data. As we had already mentioned in previous posts, good setup conditions for long entry correspond to values greater than 80% in these indicators.
While these indicators are not intended to be used as entry techniques (e.g. once the setup condition is met other entry techniques can be used to obtain better results), a rough estimate for the long entry point occurs when AboySetup1 crosses the 80% line downward. The last two times this condition was met it resulted in gains of over $70,000 and $43,000 per contract, respectively.
Note also that the commercials are out of the market right now. We need to watch out for a possible correction/reversal downwards.
Actual Trade Results based on AboySetup1 (COT Proxy)
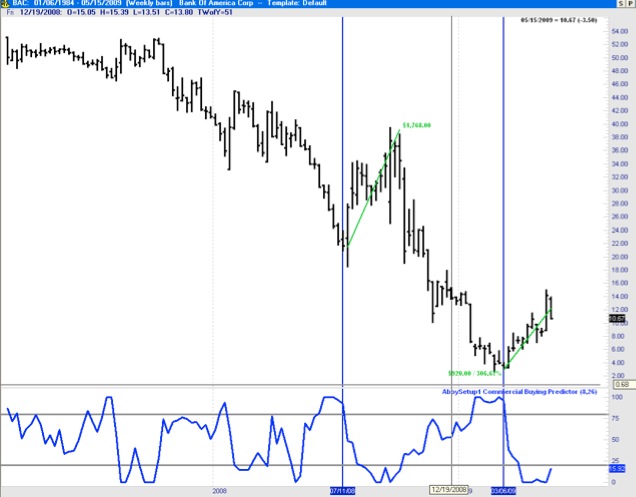
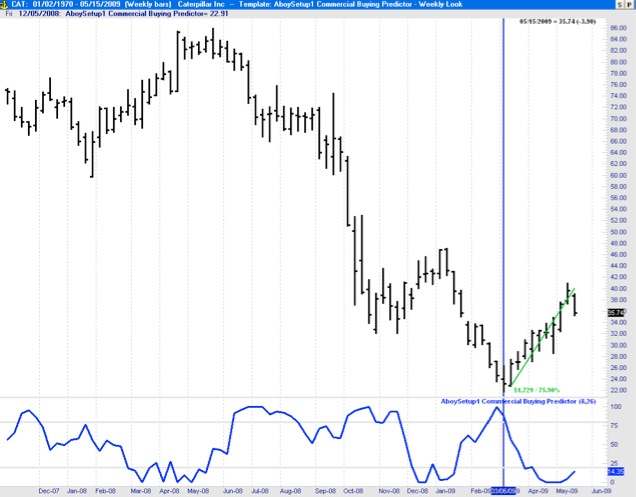
I have been using the AboySetup1 Commercial Buying Predictor (COT Proxy) to guide actual stock trades. Below are the results of a sample real trade (entry during the first week of March and exit the first week of May).
SCREENSHOTS WITH ACTUAL RESULTS: BAC (268.10%), GE (106.62%), CAT (58.07%)
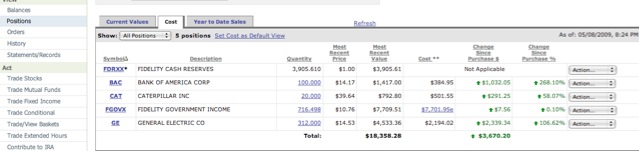
BANK OF AMERICA (BAC): March to May. Actual Realized Gain: 268%
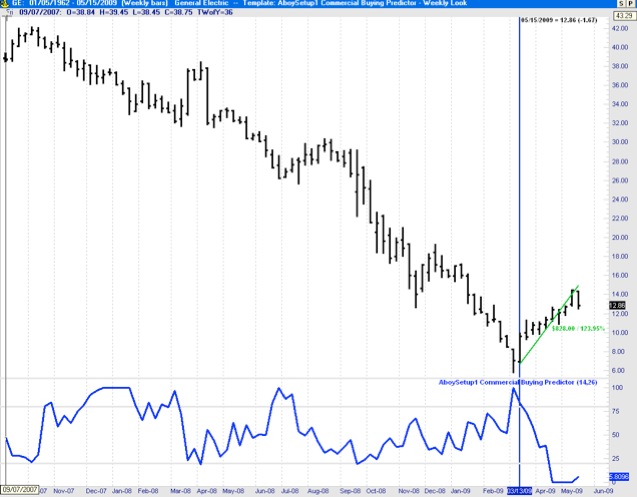
GENERAL ELECTRIC (GE) : March to May. Actual Realized Gain: 106.62%
CATERPILLAR (CAT) : March to May. Actual Realized Gain: 58.07%
SCREENSHOTS WITH ACTUAL RESULTS: BAC (268.10%), GE (106.62%), CAT (58.07%)
BANK OF AMERICA (BAC): March to May. Actual Realized Gain: 268%
GENERAL ELECTRIC (GE) : March to May. Actual Realized Gain: 106.62%
CATERPILLAR (CAT) : March to May. Actual Realized Gain: 58.07%
Follow-up on Anounced Choices
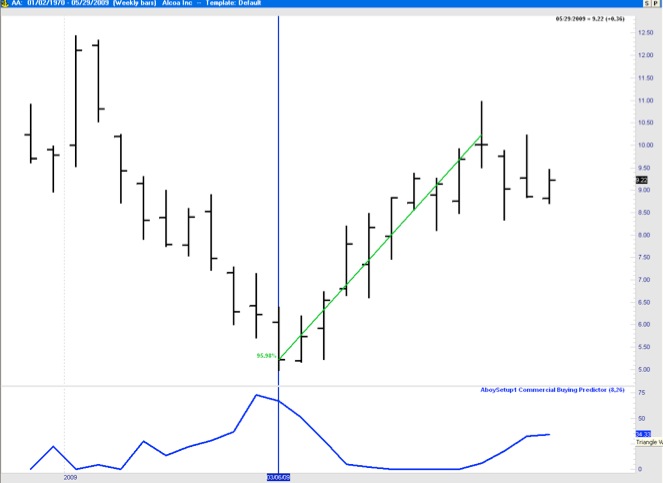
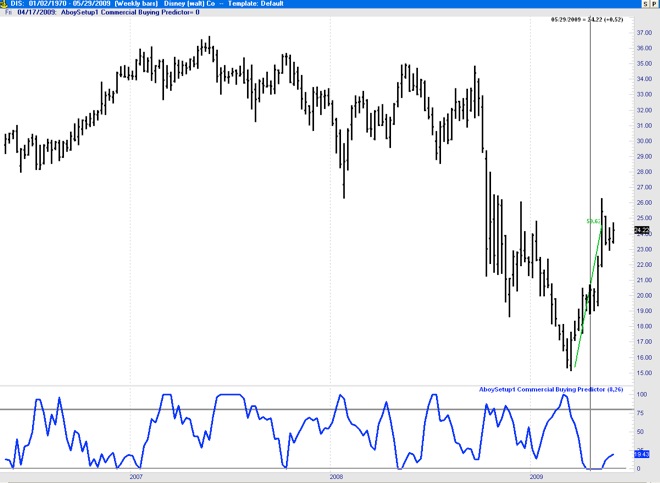
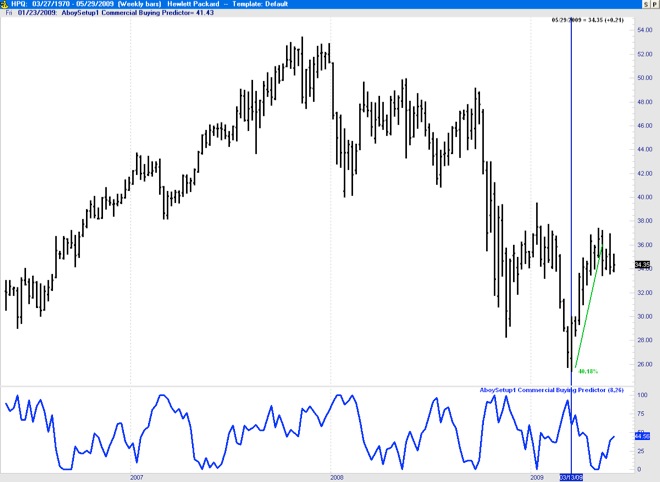
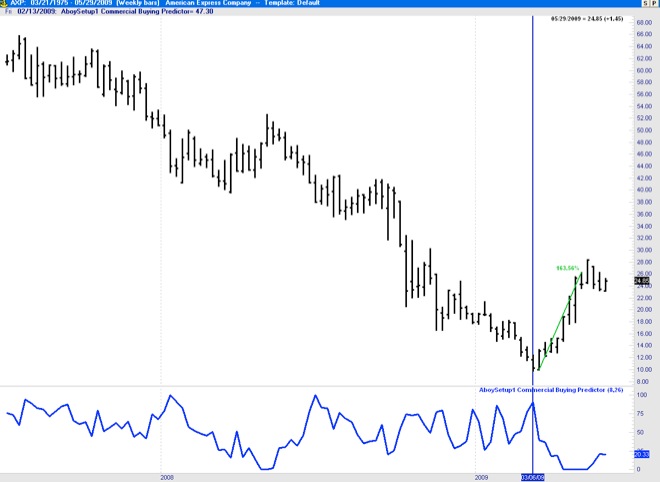
Back in October I selected GE, DIS, HPQ, AXP, and AA as the stocks with potential for beating the Dow Jones this year. As always we must wait to enter until the setup conditions are met at least based on the AboySetup1 Commercial Buying Predictor - COT Proxy (see other posts for specifics about this proprietary indicator) and confirmed by others such as the ADX. Based on the S&P500 seasonality, good entries typically happen in October or March. This year, however, the setup conditions for Long Entry were not meet until the first week of March (for most of them, see charts below) and Exit setup conditions took placed in the first week of May (which is also a good exit month based on seasonality). Here is a report with the results based on two months in the market: AA (95%), DIS (52%), HP (42%), AXP (163%), GE (106%).
ALCOA (AA): 95.98%
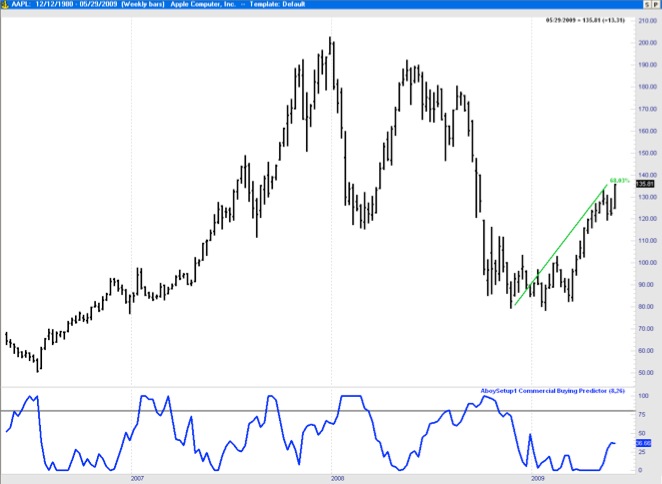
APPLE (AAPL): 68.03%
DISNEY(DIS): 52%
HEWLETT PACKARD (HPQ): 40.18%
AMERICAN EXPRESS COMPANY (AXP): 163%
ALCOA (AA): 95.98%
APPLE (AAPL): 68.03%
DISNEY(DIS): 52%
HEWLETT PACKARD (HPQ): 40.18%
AMERICAN EXPRESS COMPANY (AXP): 163%
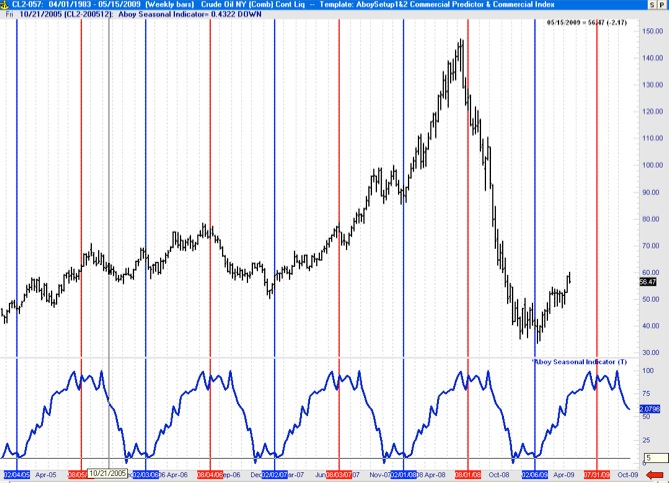
Seasonal Analysis of Crude Oil
May/16/2009 14:15 Filed in: Energy Markets | Seasonal Analysis | Proprietary Indicators | Commodity Monthly Analysis
Below a show the results of my study on seasonal tendencies of crude oil (Crude Oil NY). The chart shows the price of crude oil from March 2005 to May 2009 (top plot) and the associated Aboy Seasonal Indicator developed from the daily crude oil time series from 1990 to 2007 (bottom plot in blue). As shown below there are strong seasonal tendencies is this energy commodity. Crude oil yearly lows typically occur around the first week of February and market highs around the last week of July and first week of August.
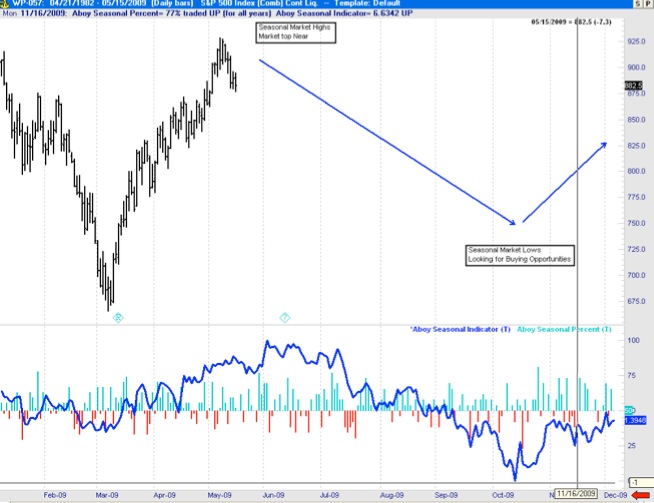
Seasonal Analysis of the S&P500 (2008/2009)
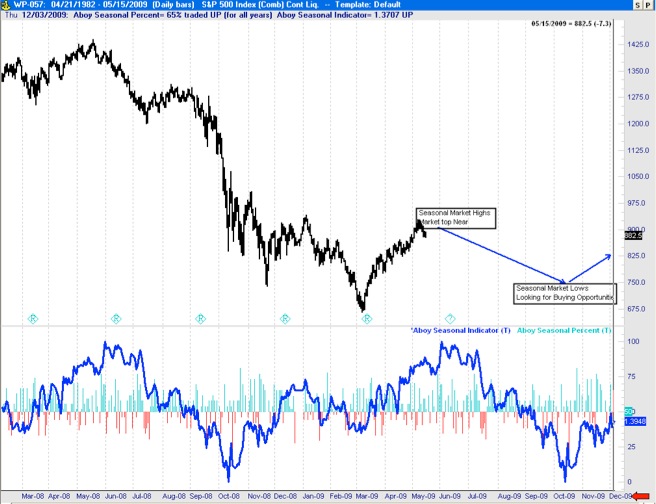
The chart below shows the price time series for the S&P500 (top plot) and my seasonality analysis based on my proprietary Aboy Seasonal Indicator (bottom plot in blue). This indicator is generated using S&P500 data from 1985 to 2007. We use it on this data to generate a predictive seasonal indicator for the following year (e.g. 2008/9). Based on this seasonal indicator, for instance, we knew that the market would make lows in the October 08 and November 08 timeframe, as well as the March 2009. The March 2009 was indeed a very good entry point. These seasonal tendencies indicate that the market is about to top (June/July timeframe). This indicates that it may be a good time to exit around now and wait for good buying opportunities (i.e. market lows) in the October/November timeframe.
Aboy Seasonal Percent indicates the proportion of times a given trading day of the year close up (green) or down (red) over the 1985 to 2007 period.
FEBRUARY 2009 TO MAY 2009:
Prediction based on Seasonal Tendencies from May 09 to December 09
MAY 2008 TO MAY 2009:
Prediction based on Seasonal Tendencies from May 09 to December 09
Follow-up on previous setups (Gold)
May/09/2009 14:04 Filed in: Commodity Monthly Analysis
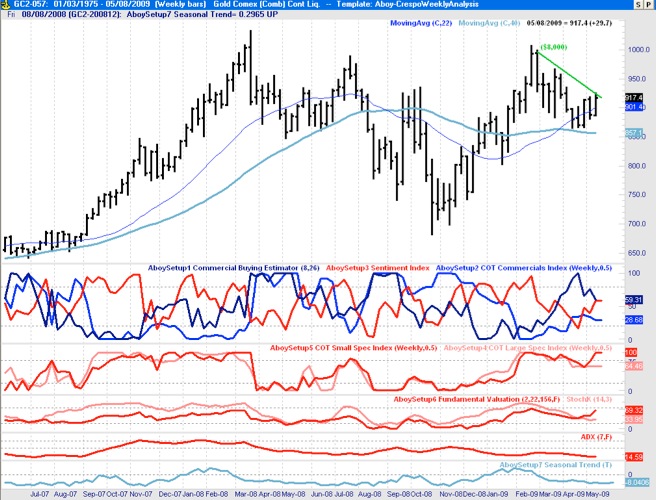
In my February 1st, 2009 commentary (Setup Condition for Gold) I stated that “Gold has good fundamental conditions for going SHORT [...] while the trend is bullish, Gold is setup for a big sell.” This was a very contrarian view at the time due to the economic situation but as the chart shows below between February 1st and May 8th, 2009 gold went down around $8000 per contract. Those that went short made over $8000 per $2025.00 contract.
Setup Condition for Cocoa (March 09 W1)
March/01/2009 20:46 Filed in: Commodity Monthly Analysis
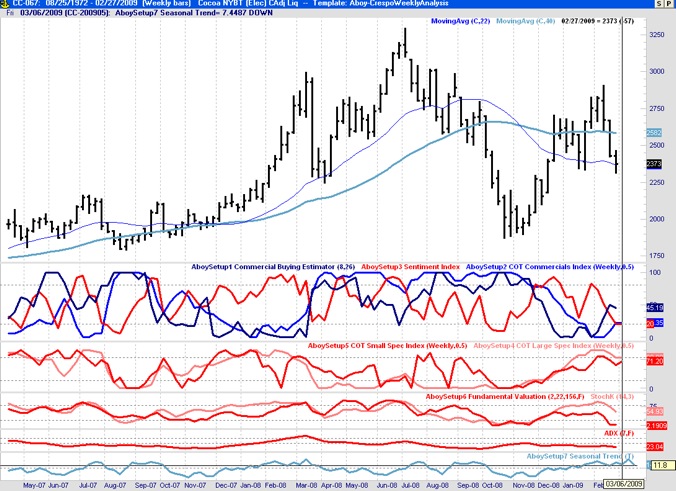
Cocoa has good fundamental setup conditions for going SHORT. See weekly chart below. The commercial index and commercial estimator reached minimum levels last week while small-traders, large-traders, and sentiment were reaching maximum levels. We could have entered short already and it is still a valid entry.
Analysis of Stocks using AboySetup1
February/11/2009 19:32 Filed in: Proprietary Indicators | Stocks
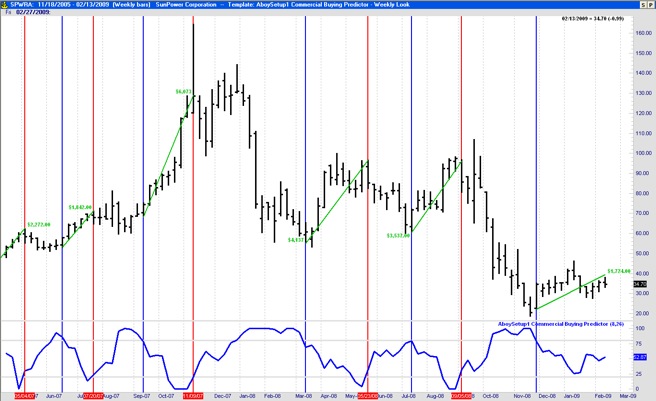
One of my readers emailed me asking about using my “Aboy1 Commercial Buying Predictor” (designed for commodities) to analyze setup conditions for individual stocks. As I mentioned in previous postings, this proprietary indicator can be calculated from the price time-series only (it does not require COT data). Consequently, it is available for individual stocks and it is extremely useful. The reader specifically asked for an analysis of a specific stock (SPWRA: SunPower Corporation) using the AboySetup1 indicator.
Below I show the chart of the requested stock (SPWRA) with the AboySetup1 indicator at the bottom. When this indicator goes over 80% it indicates a good setup condition for buying and when it goes under 20% it indicates a good setup condition for selling. While AboySetup1 is not designed as an indicator to determine entry, it can be used get a general sense on when to enter (AboySetup1 crosses downward the 80% line -shown as a blue line on the chart) and exit (Aboy1 crosses upward the 20% line -shown as a red line) the market.
Below I show the chart of the requested stock (SPWRA) with the AboySetup1 indicator at the bottom. When this indicator goes over 80% it indicates a good setup condition for buying and when it goes under 20% it indicates a good setup condition for selling. While AboySetup1 is not designed as an indicator to determine entry, it can be used get a general sense on when to enter (AboySetup1 crosses downward the 80% line -shown as a blue line on the chart) and exit (Aboy1 crosses upward the 20% line -shown as a red line) the market.
Analysis of Gold using AboySetup1
February/01/2009 23:26 Filed in: Proprietary Indicators
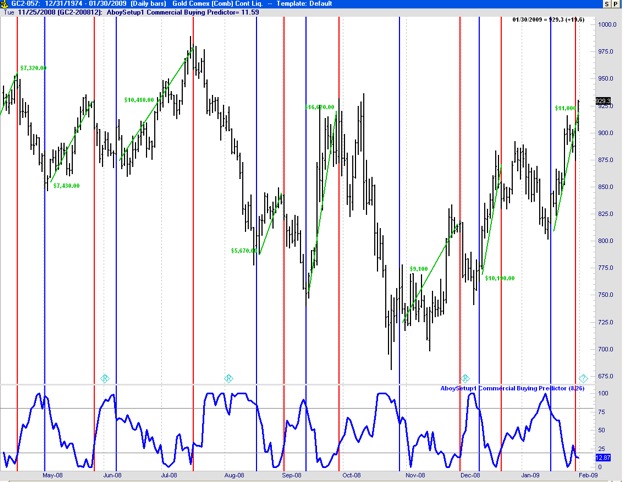
A couple of people have emailed me asking about my proprietary setup indicator (AboySetup1) and how well does it do in Gold. Below is a chart showing Gold and the AboySetup1 indicator. In blue I marked the entry points based only on setup conditions (i.e. AboySetup1 > 80% and entering when AboySetup1 crosses downward the 80% line). The exit is marked when AboySetup1 goes low <20% and crosses upward the 20% line (seen in red). I only marked the profits made from May 08 to February 09 taking the LONG positions. The profits taking the SHORT positions are even better (i.e. entering short at the start of the red line and exiting the position once we reach the blue line). The margin required is to trade the Gold contract $2,025.00. The profits over this period using only this indicator (taking both long and short positions) are over $100,000 (on an initial $10,000 account -i.e. $2,025 to trade the contract, and the rest for margin).
Setup Condition for Gold (February 09 W1)
February/01/2009 22:53 Filed in: Commodity Monthly Analysis
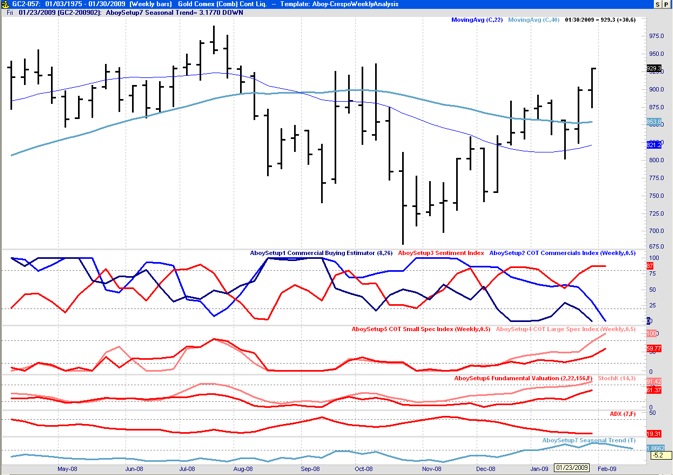
Gold has good fundamental setup conditions for going SHORT. See weekly chart below.
Conditions Summary:
-AboySetup1 Commercial Buying Estimator: very low <10%
-AboySetup2 Commercials Index: very low <10%
-AboySetup3 Sentiment Index: high < 80%
-AboySetup4 Large Traders Index: very high > 90%
-AboySetup5 Small Traders Index: high > 60%
-AboySetup6 Fundamental Valuation Index : overvalued
-AboySetup7 Seasonal: around the highest point to buy
-Stochastic: overbought >80%
-ADX: decreases
Analysis:
-While the trend is bullish, Gold is setup for a big sell. Given the economic situation people is buying Gold (they think this is a good idea given the uncertainty in the dollar, etc). Sentiment is very high (i.e. brokerage newsletters, brokers, etc are recommending buying gold). Note, however, that the commercials are completely out of the market. It may take a few weeks but we need to be ready for SHORT entries.
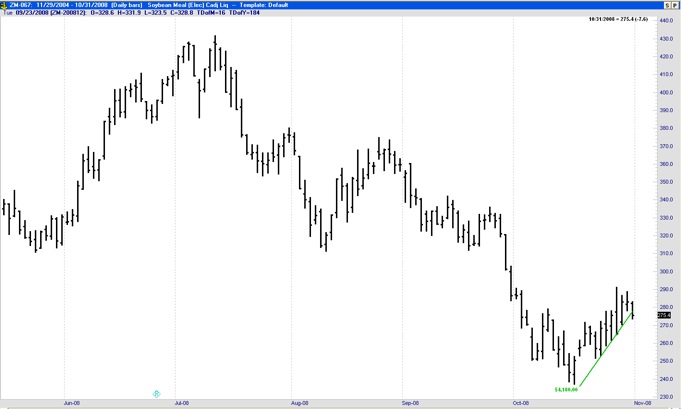
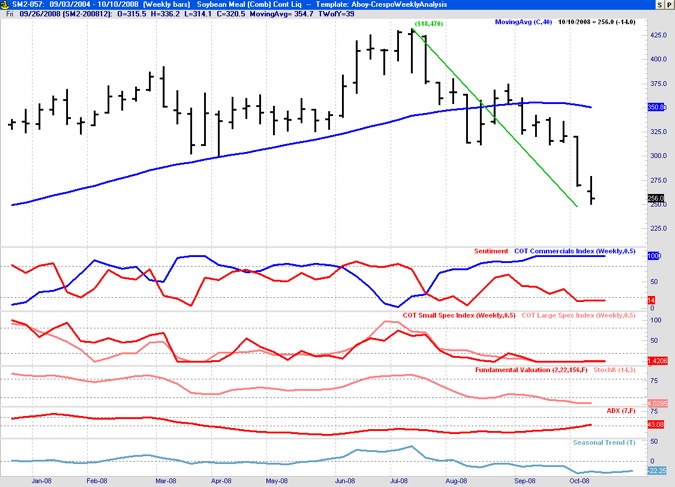
Follow-up on previous setups (Soybean Meal)
February/01/2009 22:33 Filed in: Commodity Monthly Analysis
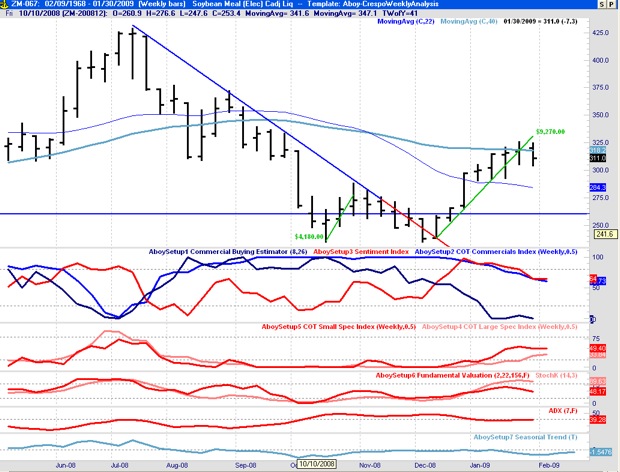
Below is the follow-up results of my analysis of the setup conditions and entry for Soybean Meal (November W3). It amounts to $9,270.00 per contract. Note that one contract of Soybean Meal only requires a margin of $743.00. This is an outstanding return!
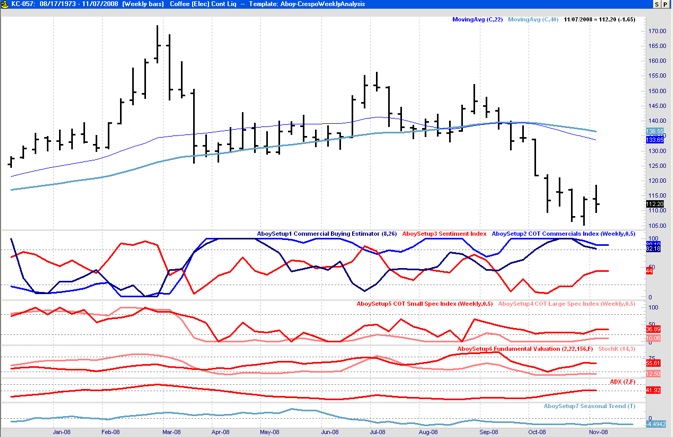
Follow-up on previous setups (Coffee)
February/01/2009 22:30 Filed in: Commodity Monthly Analysis
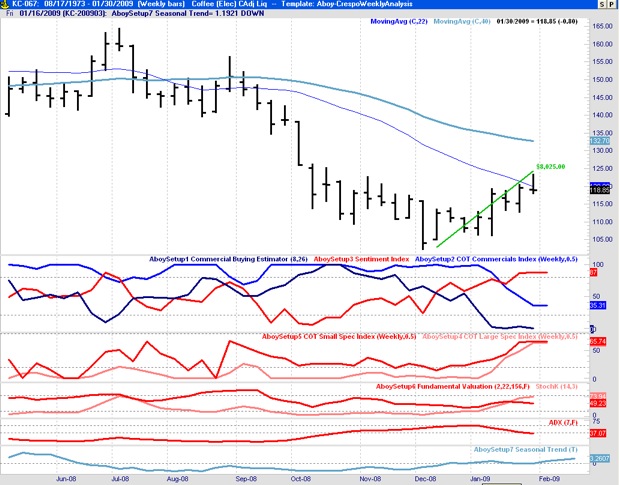
Below is the follow-up results of my analysis of the setup conditions and entry for Coffee (November W2). It amounts to $8,025.00 per contract. Note that one contract of Coffee only requires a margin of $1,680.00. This is an outstanding return!
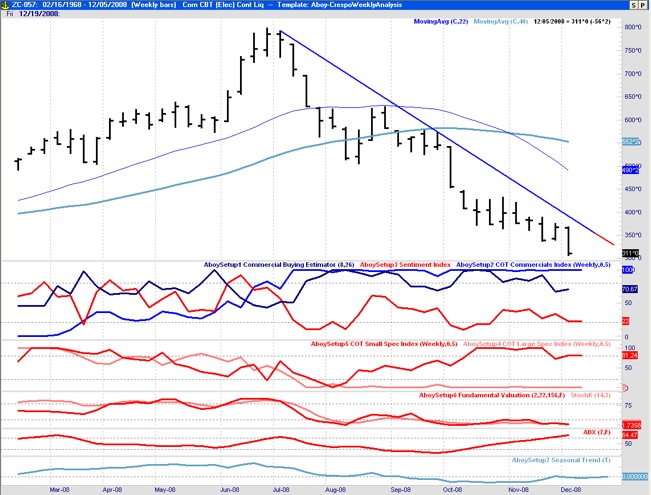
Setup Conditions for Corn (December)
December/07/2008 22:21 Filed in: Commodity Monthly Analysis
Corn has good fundamental setup conditions. See weekly chart below.
Conditions Summary:
-AboySetup1 Commercial Buying Estimator: high
-AboySetup2 Commercials Index: high > 80%
-AboySetup3 Sentiment Index: low < 25%
-AboySetup4 Large Traders Index: low > 20%
-AboySetup5 Small Traders Index: high < 80%
-AboySetup6 Fundamental Valuation Index : low < 25%
-AboySetup7 Seasonal: around the lowest points
-Stochastic: oversold <20%
-ADX: over 60
Analysis:
-Long Entry requires closings above 370. The overall trend is bearish.
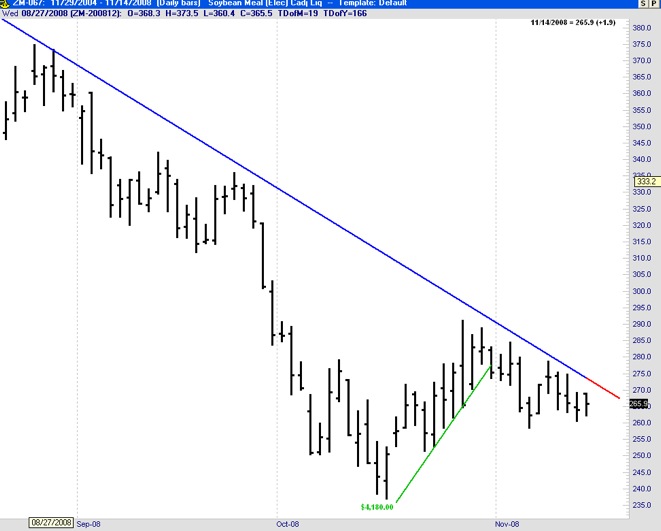
Setup Condition for Soybean Meal (November W3)
November/16/2008 21:55 Filed in: Commodity Monthly Analysis
Soybean Meal has good fundamental setup conditions and is ready for entry again. See weekly chart below.
Conditions Summary:
-AboySetup1 Commercial Buying Estimator: high & decreasing
-AboySetup2 Commercials Index: high > 80%
-AboySetup3 Sentiment Index: moderate/low < 50%
-AboySetup4 Large Traders Index: low <20%
-AboySetup5 Small Traders Index: moderate < 35%
-AboySetup6 Fundamental Valuation Index : normal < 55%
-AboySetup7 Seasonal: around the lowest points
-Stochastic: oversold <20%
-ADX: maximum reached
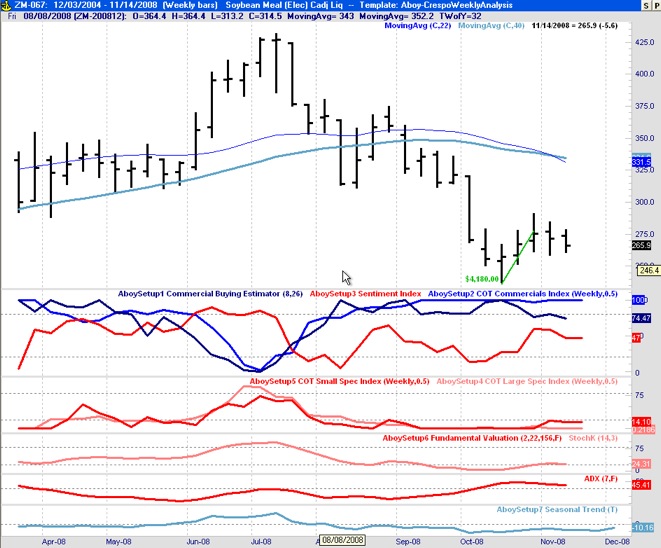
Analysis/Action:
Entry: Long Stop 269.30; Stop 260.00 (see daily chart below)
Conditions Summary:
-AboySetup1 Commercial Buying Estimator: high & decreasing
-AboySetup2 Commercials Index: high > 80%
-AboySetup3 Sentiment Index: moderate/low < 50%
-AboySetup4 Large Traders Index: low <20%
-AboySetup5 Small Traders Index: moderate < 35%
-AboySetup6 Fundamental Valuation Index : normal < 55%
-AboySetup7 Seasonal: around the lowest points
-Stochastic: oversold <20%
-ADX: maximum reached
Analysis/Action:
Entry: Long Stop 269.30; Stop 260.00 (see daily chart below)
Setup Condition for Coffee (November W2)
November/09/2008 20:33 Filed in: Commodity Monthly Analysis
Coffee has good fundamental setup conditions and is ready for entry. See chart below.
Conditions Summary:
-AboySetup1 Commercial Buying Estimator: high >80%
-AboySetup2 Commercials Index: high > 80%
-AboySetup3 Sentiment Index: moderate/low < 50%
-AboySetup4 Large Traders Index: low <20%
-AboySetup5 Small Traders Index: moderate < 35%
-AboySetup6 Fundamental Valuation Index : normal < 55%
-AboySetup7 Seasonal: around the lowest points
-Stochastic: oversold <20%
-ADX: maximum reached
Analysis/Action:
Entry: Long Stop 117.10; Stop 112.65
Economic Purpose of Future Markets and Fundamentals
November/02/2008 22:20 Filed in: Fundamentals
I have been getting some questions regarding the fundamentals of futures markets. First of all, it is important to understand that commodities and futures do not trade in shares like stocks. They trade in contracts. Each futures contract has a standard size that has been set by the futures exchange it trades on. Each commodity or futures contract is different and have contract specifications. For instance, the contract size for gold futures is 100 ounces, which means when you are buying 1 contract of gold, you are really controlling 100 ounces of gold. Consequently, if the price of gold moves $1 higher, that will affect the position by $100 ($1 x 100 ounces). Commodities and Futures markets are characterized by high leverage (i.e. with a small amount of money -the contract- you control a significantly higher amount of the commodity).
Below are some important excepts from the Education Center of the U.S. Commodity Futures Trading Commission regarding future contracts:
Many people think that futures markets are just about speculating or “gambling.” Futures markets can be used for speculating, but they are designed as vehicles for hedging and risk management so that people can avoid “gambling” if that is not their choice. For example, a wheat farmer who plants a crop is, in effect, betting that the price of wheat won’t drop so low that the farmer would have been better off not planting at all. This bet is inherent to the farming business, but the farmer may prefer not to make it. The farmer can hedge this bet by selling a wheat futures contract. Futures markets can be used for both hedging and speculating.
Forward Contracts
Because a forward contract is similar to a futures contract from an economic standpoint, it is helpful to begin by defining a forward contract. A forward contract is an agreement between two parties (say, a wheat farmer and a breakfast cereal manufacturer) in which the seller (the farmer) agrees to deliver to the buyer (the cereal manufacturer) a specified quantity and quality of an asset or commodity (the wheat) at a specified future date at an agreed upon price. A forward contract can be distinguished from a spot contract, that is, a contract for immediate delivery of the commodity.
A forward contract is typically a privately negotiated bilateral contract that is not conducted on an organized marketplace or exchange. The contract terms are not standardized but are determined by what the parties agree on. The price generally is determined when the contract is entered into, although there are some forward contracts where the parties may agree to transact at a price to be determined later in a manner that is specified on the day the contract is entered into.
Forward contracts are primarily merchandising vehicles, whereby both parties expect to make or take delivery of the commodity on the agreed upon date. It is difficult to get out of a forward contract unless you can get your counterparty to agree to extinguish the contract. To enter into a forward contract, it is also necessary to find someone who wants to buy exactly what you want to sell when and where you want to sell it. As such, forward contracts are commonly used as merchandising vehicles in a variety of commodity and currency markets; however, forward contracts lack certain features that make futures contracts especially useful for hedging.
Futures Contracts
Futures contracts are very similar to forward contracts, but futures contracts typically have certain features that make them more useful for hedging and less useful for merchandising than forward contracts. These include the ability to extinguish positions through offset, rather than actual delivery of the commodity, and standardization of contract terms.
Futures contracts typically are traded on organized exchanges in a wide variety of physical commodities (including grains, metals, and petroleum products) and financial instruments (such as stocks, bonds, and currencies). Before around 1970, most futures trading was in agricultural commodities, such as corn and wheat. Today, successful futures markets exist in a variety of non-agricultural commodities, including metals such as gold, silver, and copper and fossil fuels such as crude oil and natural gas.
The most widely traded futures contracts are in financial instruments, such as interest rates, foreign currencies, and stock indexes. Single-stock futures, banned in the United States for many years, began trading in November 2002.
Traditionally, futures contracts were traded in an open outcry environment where traders and brokers in brightly colored jackets shout bids and offers in a trading pit or ring. While open outcry is still the primary method of trading agricultural and other physical commodity futures in the U.S., trading in many financial futures has been migrating to electronic trading platforms (where market participants post their bids and offers on a computerized trading system). Almost all futures trading outside the U.S. is conducted on electronic platforms.
Standardized terms. Futures contracts have standardized terms that are determined by the exchange, rather than by market participants. Standardized terms include the amount of the commodity to be delivered (the contract size), delivery months, the last trading day, the delivery location or locations, and acceptable qualities or grades of the commodity.
For example, the Chicago Board of Trade (CBOT) wheat futures contract provides for delivery of 5,000 bushels of any of several varieties of wheat during March, May, July, September, or December in Chicago or any of several other specified delivery locations. The exchange specifies that different varieties and grades can be delivered at various fixed differentials (premiums or discounts) to the contract price.
This standardization enhances liquidity, by making it possible for large numbers of market participants to trade the same instrument. This liquidity makes the contract more useful for hedging, but, on the other hand, the standardization reduces the usefulness of a futures contract as a merchandising vehicle.
A Nebraska farmer who wants to deliver wheat to his or her elevator near Omaha, might find the CBOT wheat futures contract useful for hedging, but would not want to make delivery on the futures contract, since the closest CBOT wheat futures delivery point is in St. Louis. Instead, he or she will buy back or offset the contract before the last trading day and sell the wheat on the spot market locally, as they would have if they had not used the futures market. Most futures contracts (by volume) are liquidated via offset and do not result in delivery. The purpose of the physical delivery provision is to ensure convergence between the futures price and the cash market price.
Clearing. Futures trades that are made on an exchange are cleared through a clearing organization (clearing house), which acts as the buyer to all sellers and the seller to all buyers. When you buy or sell a futures contract, you are technically buying from, or selling to, the clearing organization rather than the party with whom you executed the transaction on the trading floor or through an electronic trading platform. Since you ultimately buy and sell from the same party, if you buy a futures contract and subsequently sell it (probably to a different party than you bought it from but technically back to the clearing house), you have offset your position and the contract is extinguished. Compare this to the forward market: If you buy a forward contract and then sell an identical forward contract to a different person, you now have obligations under two contracts—one long and one short.
Margin. Futures traders are not required to put up the entire value of a contract. Rather, they are required to post a margin that is typically between 2 percent and 10 percent of the total value of the contract. Margins in the futures markets are not down payments like stock margins, but are performance bonds designed to ensure that traders can meet their financial obligations.
When a futures trader enters into a futures position, he or she is required to post initial margin of an amount specified by the exchange or clearing organization. Thereafter, the position is "marked to the market" daily. If the futures position loses value when the market moves against it—if, for example, you are buying and the market goes down—the amount of money in the margin account will decline accordingly. If the amount of money in the margin account falls below the specified maintenance margin (which is set at a level less than or equal to the initial margin), the futures trader will be required to post additional variation margin to bring the account up the initial margin level. On the other hand, if the futures position is profitable, the profits will be added to the margin account. Futures commission merchants (FCMs) often require their customers to maintain funds in their margin accounts that exceed the levels specified by an exchange.
The Role of the Speculator
A speculator is one who does not produce or use a commodity, but risks his or her own capital trading futures in that commodity in hopes of making a profit on price changes. While speculation is not considered one of the economic purposes of futures markets, speculators do help make futures markets function better by providing liquidity, or the ability to buy and sell futures contracts quickly without materially affecting the price. Long and short hedgers may not be sufficient to create a liquid futures market by themselves. The participation of speculators willing to take the other side of hedgers' trades adds liquidity and makes it easier for hedgers to hedge.
Types of speculators include:
• Position traders have an opinion about general price trends and will hold a position for several days or weeks.
• Day traders will close out positions by the end of the trading day (and avoid overnight margin calls).
• Scalpers are exchange members who only hold positions for a few minutes or even seconds. These members “make markets,” that is, they post or shout bids and offers for the contract. The bid (the price at which a market maker is willing to buy the contract) is a little bit lower than the offer (the price at which the market maker is willing to sell the contract). For example, the bid for CBOT December wheat might be $3.50 and the offer might be $3.50½. Scalpers endeavor to profit from the difference between the bid and the offer, generally referred to as the bid-ask spread.
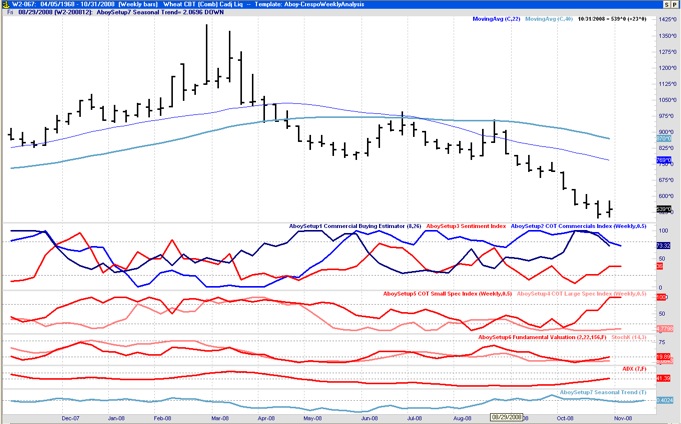
Setup Condition for Wheat (November 08 W1)
November/02/2008 20:53 Filed in: Commodity Monthly Analysis
Below is an update for the Setup Condition for Wheat.
Conditions:
-The setup conditions were evaluated last month. Below is an updated chart.
Analysis:
-It looks like the time is right for entry in this commodity. Our entry techniques indicate to buy long on a stop at 546^6. Stop is 517.00.
Conditions:
-The setup conditions were evaluated last month. Below is an updated chart.
Analysis:
-It looks like the time is right for entry in this commodity. Our entry techniques indicate to buy long on a stop at 546^6. Stop is 517.00.
Follow-up on previous setups
November/02/2008 20:44 Filed in: Commodity Monthly Analysis
Below are the results for Soybean Meal. Note that $4,180.00 were made per contract since the original posting of the setup condition. Copper did not met the requirements specified.
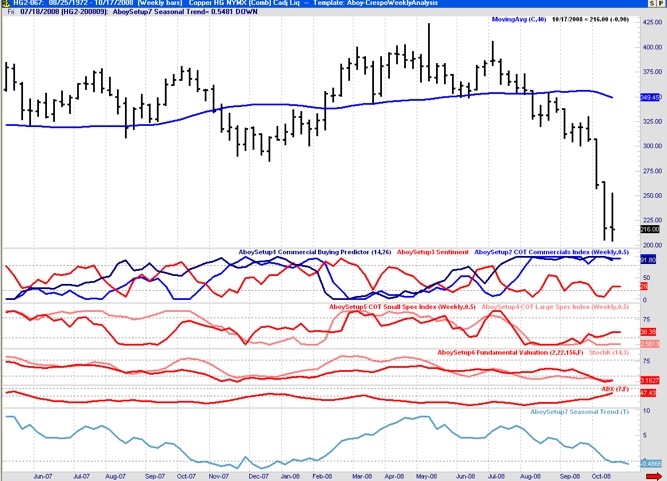
Setup Condition for Copper (October 08 W4)
October/19/2008 20:51 Filed in: Commodity Monthly Analysis
In the Metal commodities Copper shows good setup conditions this week:
Conditions:
-AboySetup1 Commercial Buying Estimator: high >80%
-AboySetup2 Commercials Index: high > 80%
-AboySetup3 Sentiment Index: low < 20%
-AboySetup4 Large Traders Index: low <20%
-AboySetup5 Small Traders Index: moderate < 35%
-AboySetup6 Fundamental Valuation Index : undervalued <20%
-AboySetup7 Seasonal: around the lowest points
-Stochastic: oversold <20%
-ADX: still waiting for a maximum and reversal
Analysis:
-Copper has good setup conditions. The specific entry technique depends on the system used and the tolerance for risk. Buying long would require the price to move above of 223.70 (i.e. buy long on stop at 223.70) with a stop at 205.50.
Follow-up on previous week setups
October/19/2008 19:52 Filed in: Commodity Monthly Analysis
Last week we analyzed the setup conditions for Soybean Meal. The cost of 1 contract for this commodity is $743.00. The price increase from Thursday to Friday was $1590.00 (per contract). This commodity still has all the setup conditions to keep increasing.
The previous analysis (W2) of setup conditions is still valid.
The previous analysis (W2) of setup conditions is still valid.
Using market sentiment to guide trading
October/12/2008 22:48 Filed in: Fundamentals
I will try to answer selected email questions sent by readers of this blog directly on the blog. Due to time constrains I will try to answer between one and three questions per week. A reader of the blog sent me the following question based on the blog entry “Are the brokers, newsletters, and sentiment always wrong?” written on October 10, 2008:
>> “So if I just do the opposite of market sentiment, I'll make lots of $?! That's a nice simple algorithm.”
For those of you with mathematical background I will say that sentiment is typically a necessary condition to excellent buy or sell opportunities but it is not sufficient one. We need other setup techniques to confirm the setup, an entry technique, and an exit technique before we can say we have a trading strategy.
However, the short answer is that even with sentiment alone you are likely to do significantly better than the general public trying to time the market (most people trying to time the market based on news do very poorly and loose money). We use sentiment as one of our six indicators to analyze setup conditions on specific markets. Once we identify that the market is setup (using commercials, large traders, small traders, valuation, seasonality, sentiment, etc), then we still need to go to the daily charts and use a proper entry technique to enter the market and an exit technique to take out the profits.
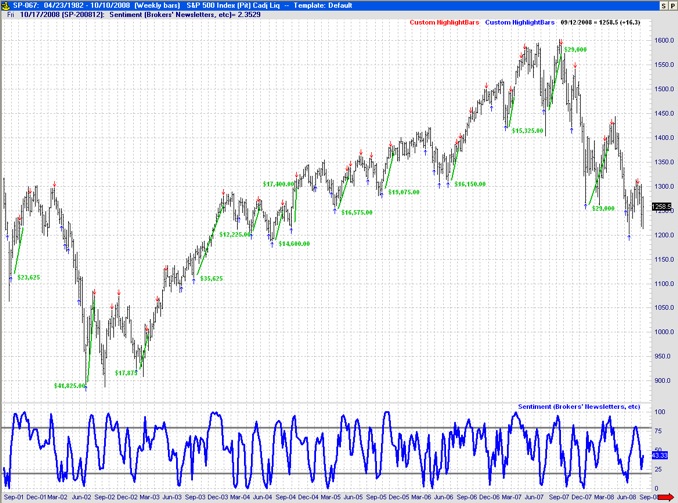
The chart below shows how we would have done trading the S&P 500 if we had enter the market every time market sentiment went from having been very low to just crossing above the 20% line (i.e. 80% of the brokers, newsletters, etc are recommending “sell, sell, sell”) and exit once sentiment crossed below the 80% line (i.e. 80% of the brokers, newsletters, etc are recommending “buy, buy, buy”). The condition was programmed and the markers appear automatically on the chart as blue up arrows (buy signal) and red down arrows (sell signal). I also show a sample of the profits we would have made if we were trading one contract of the S&P500 future ($17,318.00). Note that we had many trades since 2001 that made 100% profit (i.e. a return of $17,328.00 on an $17,328.00). The reality, however, is that the trading account would need to be larger than $17,328.00 -otherwise we would be risking 100% of it in every trade. We will discuss the concept of “risk-of-ruin” in future entries and on the members area since its is a very important concept for sound money management.
>> “So if I just do the opposite of market sentiment, I'll make lots of $?! That's a nice simple algorithm.”
For those of you with mathematical background I will say that sentiment is typically a necessary condition to excellent buy or sell opportunities but it is not sufficient one. We need other setup techniques to confirm the setup, an entry technique, and an exit technique before we can say we have a trading strategy.
However, the short answer is that even with sentiment alone you are likely to do significantly better than the general public trying to time the market (most people trying to time the market based on news do very poorly and loose money). We use sentiment as one of our six indicators to analyze setup conditions on specific markets. Once we identify that the market is setup (using commercials, large traders, small traders, valuation, seasonality, sentiment, etc), then we still need to go to the daily charts and use a proper entry technique to enter the market and an exit technique to take out the profits.
The chart below shows how we would have done trading the S&P 500 if we had enter the market every time market sentiment went from having been very low to just crossing above the 20% line (i.e. 80% of the brokers, newsletters, etc are recommending “sell, sell, sell”) and exit once sentiment crossed below the 80% line (i.e. 80% of the brokers, newsletters, etc are recommending “buy, buy, buy”). The condition was programmed and the markers appear automatically on the chart as blue up arrows (buy signal) and red down arrows (sell signal). I also show a sample of the profits we would have made if we were trading one contract of the S&P500 future ($17,318.00). Note that we had many trades since 2001 that made 100% profit (i.e. a return of $17,328.00 on an $17,328.00). The reality, however, is that the trading account would need to be larger than $17,328.00 -otherwise we would be risking 100% of it in every trade. We will discuss the concept of “risk-of-ruin” in future entries and on the members area since its is a very important concept for sound money management.
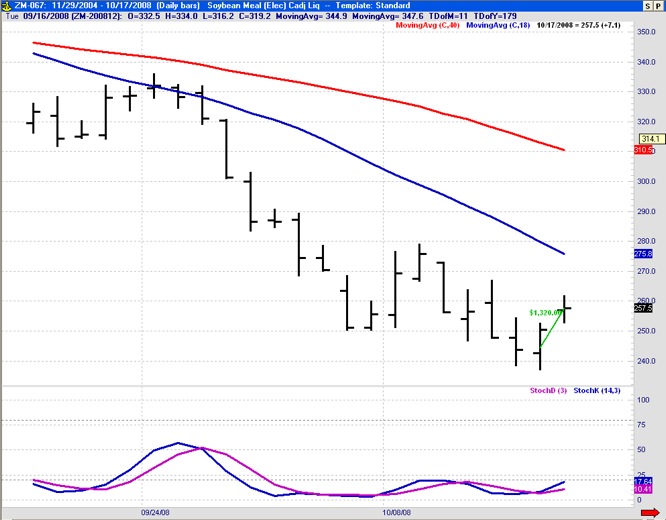
Setup Condition for Soybean Meal (October 03 W3)
October/12/2008 20:07 Filed in: Commodity Monthly Analysis
Soybean Meal shows good setup conditions this week:
Conditions:
-Commercials: high > 80%
-Sentiment: low < 20%
-Large Traders: low <20%
-Small Traders: low < 20%
-Fundamental valuation: undervalued <20%
-Stochastic: oversold <20%
-Seasonal: uptrend
-ADX: still waiting for a maximum and reversal
Analysis:
-As was the case last week (W2) there are several commodities that are developing good setup conditions. Most commodities are on a downtrend due to the overall economic environment. It is important to note, however, that many of them have been significantly oversold since Spring/Summer 08, they are currently undervalued, sentiment is very low, but users (commercial users) of natural commodities are aggressively buying. These are perfect setup conditions and opportunities to enter long assuming the proper entry conditions are also met (in addition to the setup conditions). For now, we are still waiting to see what happens this week.
Follow-up on previous week setups
October/12/2008 20:01 Filed in: Commodity Monthly Analysis
Last week we analyzed three commodities: Oats, Platinum, and Wheat. The setup conditions are still valid for Oats and Wheat. Both of these commodities are still in a downtrend but it looks like a reversal may be near. We need to be ready with our daily entry technique to profit once the reversal occurs. In the case of Platinum, it is interesting that the commercials are significantly less bullish now (51.99%) and that the large traders have started to have interest in this commodity (61.3% bullish). We need to keep an eye on it but it is starting to deviate from our optimal setup conditions that we like to see before considering a long position.
DJ Investment Choices 2008-09
October/12/2008 00:40 Filed in: Investment
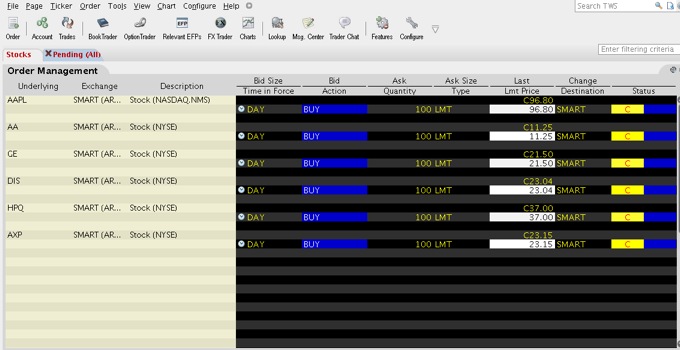
In October 2, 2008 I advanced my selection of the 5 Dow stocks that I think have potential for beating the Dow index this year (quite hard to do). Below is the current prices of these stocks (AA, GE, DIS, HPQ, and AXP). As I mentioned on the original post we need to wait for indications of a reversal but for the purposes of comparison against the index we can enter at any time. Below is a screenshot of TWS with the limit orders showing specific prices based on the close price on Friday. Obviously, it is somewhat dangerous entering right now and I wouldn’t recommend it until the technical indicators show signs of a reversal.
Note also this site focuses on commodities and evaluation of trading strategies and not stocks for investment (especially with holding times > 6 months). We are advancing this info to test a stock selection algorithm based on fundamental valuation.
Note also this site focuses on commodities and evaluation of trading strategies and not stocks for investment (especially with holding times > 6 months). We are advancing this info to test a stock selection algorithm based on fundamental valuation.
Are the brokers, newsletters, and sentiment always wrong?
October/10/2008 15:19 Filed in: Fundamentals
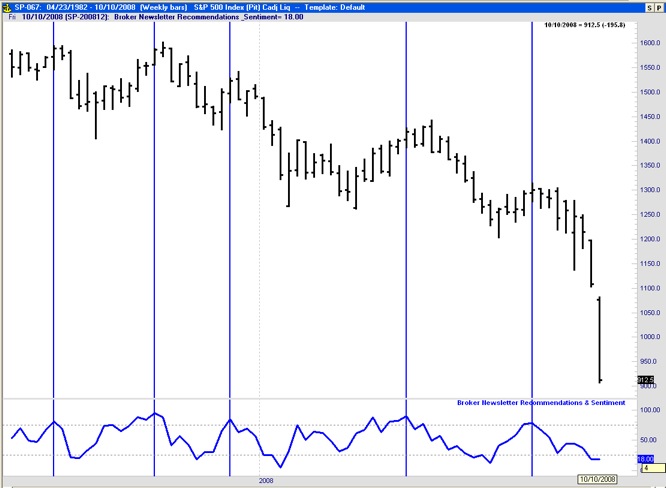
The chart below shows over a year of the S&P 500 on weekly bars on top (black) and an indicator that measures market sentiment directly from newsletters and broker recommendations at the bottom (blue). You can observe that this guys are consistently wrong. They are very bullish (as shown by indicator values above 80) after significant uptrends and this typically coincides with the end of the trend. Note how in the chart below every time the sentiment indicator went over 80% the market was at a top or very near a top proceeding a significant downtrend. They are consistently very bullish at market highs and very bearish at market lows. Note how once they get very bearish the market is typically close to a bottom also. It is important to emphasize that this behavior is not specific to the S&P500 or this year. I have studied hundreds of out of sample charts and this finding holds true. In the members area I elaborate a little bit more on why this crowd is so wrong and how we can use this information to our advantage.
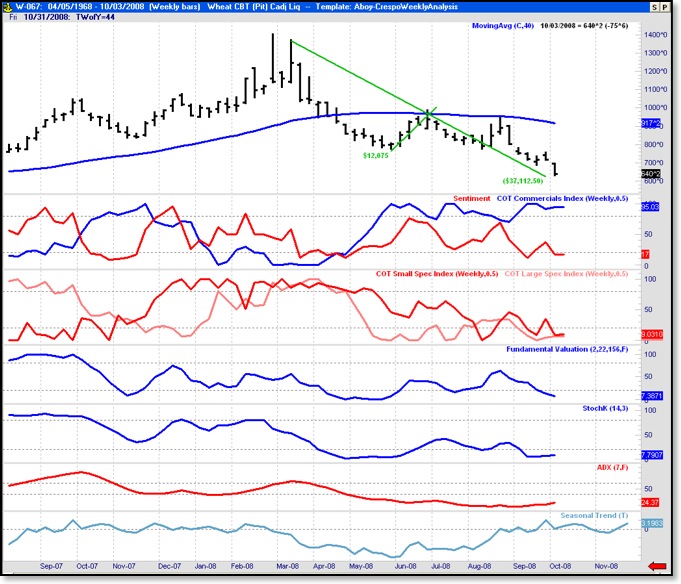
Setup Condition for Wheat (October 08 W2)
October/05/2008 20:11 Filed in: Commodity Monthly Analysis
This grain commodity exhibits very good setup conditions for the second week (W2) of October. The public and brokers sentiment is very low, the large commodity traders and funds are heavy sellers, and the small traders are very short. Our position is always contrarian to what the public is doing, to what the brokers are recommending in their newsletters (in this case they are recommending to sell wheat), and to what the small speculators are doing (currently heavy sellers). In summary, the basic setup conditions are:
Conditions:
-Commercials: high > 80%
-Sentiment: low < 20%
-Large Traders: low <20%
-Small Traders: low < 20%
-Fundamental valuation: undervalued <20%
-Stochastic: oversold <20%
-Seasonal: uptrend
-ADX: low < 20%
Analysis:
-This commodity exhibits excellent setup conditions for an uptrend but we also need to wait for the right entry. The commercials are bullish, the commodity has been oversold as seen by the stochastic (it has lost $37,000 per contract since March 08), it is fundamentally undervalued at the moment, the ADX indicates a downtrend that lacks integrity, and the seasonal tendency is favorable. In summary, we have excellent setup conditions for Wheat. This is definitely a commodity we need to follow very closely during the upcoming second week of October (October W2) and have our entry technique ready to jump in.
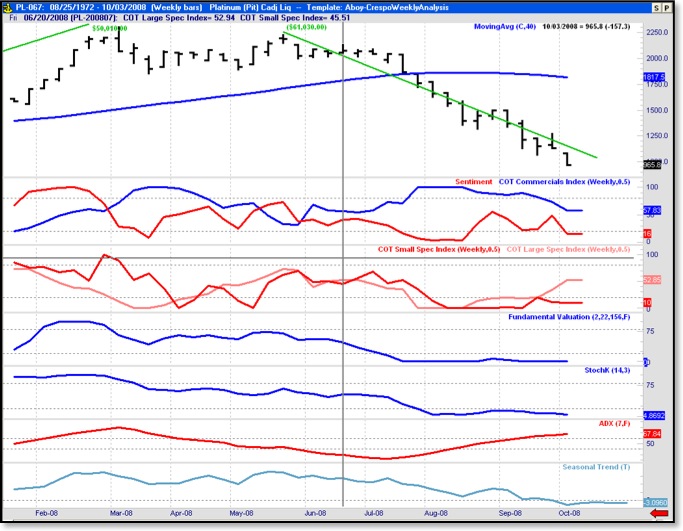
Setup Condition for Platinum (October 08 W2)
October/05/2008 14:52 Filed in: Commodity Monthly Analysis
There is a potential market setup that may develop in the next couple of weeks for PLATINUM:
Conditions:
-Commercials: moderate after having been long
-Sentiment: low < 20%
-Large Traders: moderately short
-Small Traders: low short < 20%
-Fundamental valuation: undervalued <20%
-Stochastic: oversold <20%
-Seasonal: neutral and uptrend to develop
-ADX: very high > 60%
Analysis:
-This is a metal commodity we need to keep an eye on. It lost $61,030 per contract since May 23, 2008. The ADX indicator still shows integrity on the downtrend but its high value indicates a trend reversal may be near. We need to wait for the ADX indicator to reach a maximum and initiate the reversal. This is a commodity to keep in the watch-list for the intermediate future. Depending on the general market and economic conditions it may be an opportunity to make a substantial amount of money per contract but we first need to way for the ADX and price reversal to enter. The current margin requirements are $2,160.00. At the moment, however, the COT data and ADX does not confirm it yet.
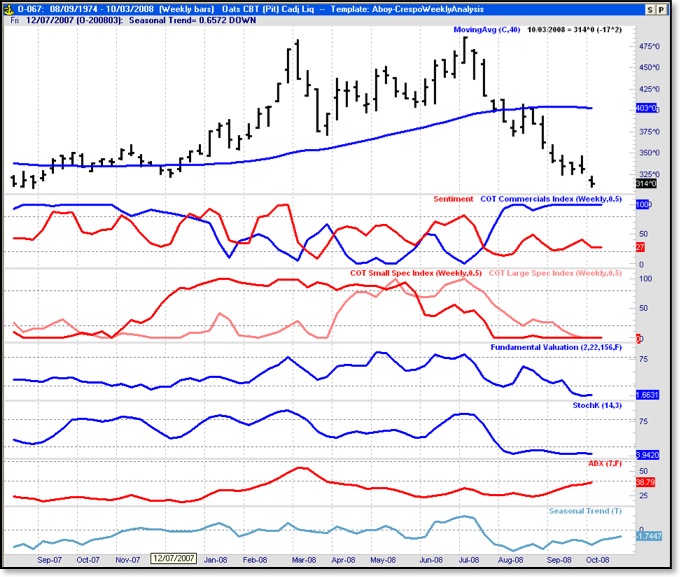
Setup Condition for Oats CBT (October 08 W2)
October/05/2008 14:18 Filed in: Commodity Monthly Analysis
There is a good market setup developing for OATS this week:
Conditions:
-Commercials: very long > 80%
-Sentiment: moderately low ~ 25%
-Large and Small Traders: very short < 20%
-Fundamental valuation: undervalued <20%
-Stochastic: oversold <20%
-Seasonal: uptrend
Analysis:
-The ADX indicator still shows integrity on the downtrend. We need to wait for the ADX indicator to reach a maximum and initiate the reversal. Then it will be a good buying with the appropriate entry technique. This is a commodity to keep in the watch-list for the near future.
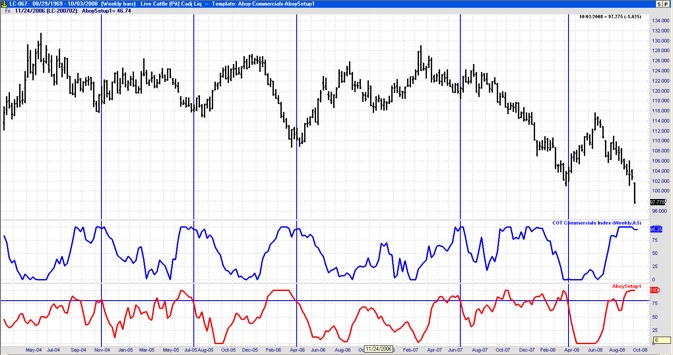
An Important Novel Indicator (AboySetup1)
October/03/2008 21:26 Filed in: Proprietary Indicators
The chart below shows a new indicator that is very useful to determine setup conditions for futures, commodities, and also individual stocks. The indicator on the top (blue line) shows the COT Commercial Indicator based on the positions of the commercials obtained from the Commitment of Traders report (the indicator is developed as a stochastic function of the commercial positions). The positions of the commercials are very useful to determine setup conditions and we will use them extensively in the development of our mechanical trading systems. The commercials have a very good track record of buying lows in the market and selling highs.
The main limitation of the COT indicator is that it requires an additional data service (COT data) and that this information is only available for selected commodities in the US. The indicator shown in red (AboySetup1) shows a setup indicator developed exclusively using the price time-series (i.e. it does not require the COT positions as an input). It is important to note that it is very correlated with the action of the commercials and serves to determine setup conditions for both futures and stocks. High values of the AboySetup1 indicate that a market uptrend turn may be near (setup condition) and low values indicate the opposite. A rough entry point that typically works well is to wait until the AboySetup1 crosses below 80% as shown in the chart. The specific entry should be determined using specialized entry techniques once this setup market condition is met. The AboySetup1 is designed to help us determine short and intermediate term setup conditions. Thus, it helps us enter at a local minima in the price time-series but we still have to use an appropriate exit technique to get out of the trade and take our profit successfully.
To my knowledge only Larry Williams has developed a similar indicator which he refers to as a COT proxy indicator. The AboySetup1 indicator was developed independently and uses a different underlying formula. At the moment we have developed 12 different versions of this COT proxy indicator relying on different formulas. This indicates that there are many possibilities to obtain similar indicators but this specific one is the one I found to perform the best.
I personally establish setup conditions based on 6 indicators. The first one (AboySetup1) is described here. The other 5 will be described on future entries.
Stock Investment Choices for 2008/09
October/02/2008 23:29 Filed in: Investment
This year has been one of the worst financial years in history. We are going through the worst credit crisis since The Great Depression and a historic Housing Market Crash. At the moment of this writing both the major indices and the vast majority of stocks are still in a major downtrend. This is very much a significant bear market.
While it is not the objective of this site to pick investment stocks, once a year we will select a set of 5 investment stocks to hold of for approximately 6-7 months. The selection is based on a proprietary stock selection algorithm based on valuation that I’m currently testing. The purpose of this blog entry is to “keep me honest” six months from now.
Here are my top-5 Dow stock picks.
-Alcoa (AA)
-General Electtric (GE)
-Walt Disney (DIS)
-Hewlett-Packard (HPQ)
-American Express (AXP)
Note: At the moment all these stocks are in a significant downtrend. The ADX still shows significant integrity to the downtrend. We need to wait for a reversal and use an appropriate entry technique.
This portfolio should be re-evaluated at the beginning of the month of May 2009. The benchmark for this portfolio is the Dow Jones Industrial. We should compare the performance of these 5 stocks combined as a single portfolio against the Dow 30 exiting from the positions in early May.
Intended Audience
July/05/2008 23:55 Filed in: Mission & Objectives
Anybody interested in the future markets will benefit from the weekly follow up of the COT data and analysis of the setup conditions developing.
Additionally we will conduct quantitative studies. While our objective is to conduct quantitative studies, our background, methodology, results, and discussion will avoid the "academic tone & jargon" of peer-reviewed research papers. Instead the conclusions will be presented in a clear and practical tone adequate for the general public and nonexperts.
Additionally we will conduct quantitative studies. While our objective is to conduct quantitative studies, our background, methodology, results, and discussion will avoid the "academic tone & jargon" of peer-reviewed research papers. Instead the conclusions will be presented in a clear and practical tone adequate for the general public and nonexperts.
Methods and Techniques
July/05/2008 23:52 Filed in: Fundamentals
The methods we will use in our evidence-based analysis include:
1) Statistics
2) Classical Time-Series Analysis
3) Complexity Theory
4) Risk-Management
5) Technical Analysis
6) Fundamental Analysis and Valuation
7) Modern Portfolio Theory
8) COT Data
Background of the fundamentals will be provided on the Fundamentals category.
These are the methods we will used primarily when we evaluate trading systems and strategies. We will also use other fundamental techniques to discuss weekly setup conditions for commodity markets.
Motivation
July/05/2008 23:51 Filed in: Mission & Objectives
As stated in the welcome page there is a wealth of financial information available. This includes thousands of websites and advisory newsletters, as well as hundres of books ranging from personal finance, portfolio management, and stock investments to day trading and scalping trading. Despite this apparent wealth of information, most of it is unreliable. Many of the simple strategies presented in trading seminars, books, and websites do not withstand even the most basic statistical testing based on historical data.
The purpose of this site is to provide evidence-based conclusions derived from quantitative analysis. At the moment, one of the few works that employs a well-researched and quantitative approach to stock investment is the seminal book by Dr. Jeremy Siegel “Stocks for the Long Run.” This classic is now considered the definitive guide to financial market returns and long-term investment strategies. Our objective is to conduct a similar study to document the performance of some of the strategies available for short-term trading in the stock and futures markes and to offer novel approaches.
The purpose of this site is to provide evidence-based conclusions derived from quantitative analysis. At the moment, one of the few works that employs a well-researched and quantitative approach to stock investment is the seminal book by Dr. Jeremy Siegel “Stocks for the Long Run.” This classic is now considered the definitive guide to financial market returns and long-term investment strategies. Our objective is to conduct a similar study to document the performance of some of the strategies available for short-term trading in the stock and futures markes and to offer novel approaches.
Mission & Objectives
July/05/2008 23:51 Filed in: Mission & Objectives
This site is devoted to evidence-based investement and trading research. Specifically, it focuses on providing well-researched and quantitative analysis of financial information and strategies for stocks, futures, commodities, ETFs and mutual funds. While the techniques employed draw from technical analysis, fundamental valuation, risk-management, and modern portflio theory, the analysis and conclusions provided are primarily based on the sound fields of statistics and statiscial time-series analysis.
Additionally, we will provide descriptions of classical indicators as well as the novel indicators we develop, portfolio selections and the corresponding benchmarks, and market follow-ups.
Additionally, we will provide descriptions of classical indicators as well as the novel indicators we develop, portfolio selections and the corresponding benchmarks, and market follow-ups.
General Disclaimer
July/05/2008 23:50 Filed in: Readme First/Disclaimers
This site is primarily a personal blog and journal. The analysis provided in the blog is not intended as trading recommendations or advise. Your use and browsing of the Site is at your risk. If you are dissatisfied with any of the Materials contained in the Site, or with any of these Terms, your sole and exclusive remedy is to discontinue accessing and using the Site.
THE SITE AND MATERIALS AND RELATED COMMUNICATIONS ARE PROVIDED "AS IS" WITHOUT ANY REPRESENTATIONS OR WARRANTIES, EXPRESSED OR IMPLIED, OF ANY KIND, INCLUDING, BUT NOT LIMITED TO, WARRANTIES OF MERCHANTABILTY, NON-INFRINGEMENT, OR FITNESS FOR PARTICULAR PURPOSE. SOME JURISDICTIONS DO NOT ALLOW FOR THE EXCLUSION OF IMPLIED WARRANTIES, SO THE ABOVE EXCLUSIONS OF IMPLIED WARRANTIES MAY NOT BE APPLICABLE UNDER CERTAIN CIRCUMSTANCES. THE AUTHOR DOES NOT WARRANT THE ACCURACY OR COMPETENESS OF THE MATERIALS, INCLUDING BUT NOT LIMITED TO THE RELIABILITY OF ANY ADVICE, STATEMENT OR OTHER INFORMATION DISPLAYED OR DISTRIBUTED THROUGH THE SITE. YOU ACKNOWLEDGE BY THE USE OF THE SITE THAT ANY RELIANCE ON ANY SUCH MATERIALS, ADVICE, STATEMENT OR INFORMATION SHALL BE AT YOUR SOLE RISK.
UNDER NO CIRCUMSTANCES WILL THE AUTHOR OR OTHER THIRD PARTIES MENTIONED AT, OR INVOLVED IN CREATING, PRODUCING, OR DELIVERING THE SITE BE LIABLE FOR ANY DIRECT, INCIDENTAL, CONSEQUENTIAL, INDIRECT, SPECIAL OR PUNITIVE DAMAGES WHATSOEVER (INCLUDING WITHOUT LIMITATION, COSTS AND EXPENSES OF ANY TYPE INCURRED, LOST PROFITS, LOST DATA OR PROGRAMS, AND BUSINESS INTERRUPTION) ARISING OUT OF YOUR ACCESS TO, USE, INABILITY TO USE OR THE RESULTS OF USE OF THE SITE, ANY WEB SITES LINKED TO THE SITE, OR ANY MATERIALS CONTAINED AT ANY OR ALL SUCH SITES (INCLUDING BUT NOT LIMITED TO THOSE CAUSED BY OR RESULTING FROM A FAILURE OF PERFORMANCE; ERROR; OMISSION; LINKING TO OTHER WEB SITES; INTERRUPTION; DELETION; DEFECT; DELAY IN OPERATION OR TRANSMISSION; COMPUTER VIRUS; COMMUNICATION LINE FAILURE; OR DESTRUCTION, UNAUTHORIZED ACCESS TO, ALTERATION OF, OR USE OF ANY COMPUTER OR SYSTEM), WHETHER BASED ON WARRANTY, CONTRACT, TORT, NEGLIGENCE, STRICT LIABILITY, OR ANY OTHER LEGAL THEORY AND WHETHER OR NOT THE AUTHOR WAS ADVISED OF THE POSSIBILITY OF SUCH DAMAGES.
THE AUTHOR SHALL HAVE NO LIABLITY OR RESPONSIBILITY FOR ANY ACTS, OMISSIONS, OR CONDUCT OF ANY USER OR OTHER THIRD PARTY.